identify the graph for the equation. \n$y = 18(2)^x$
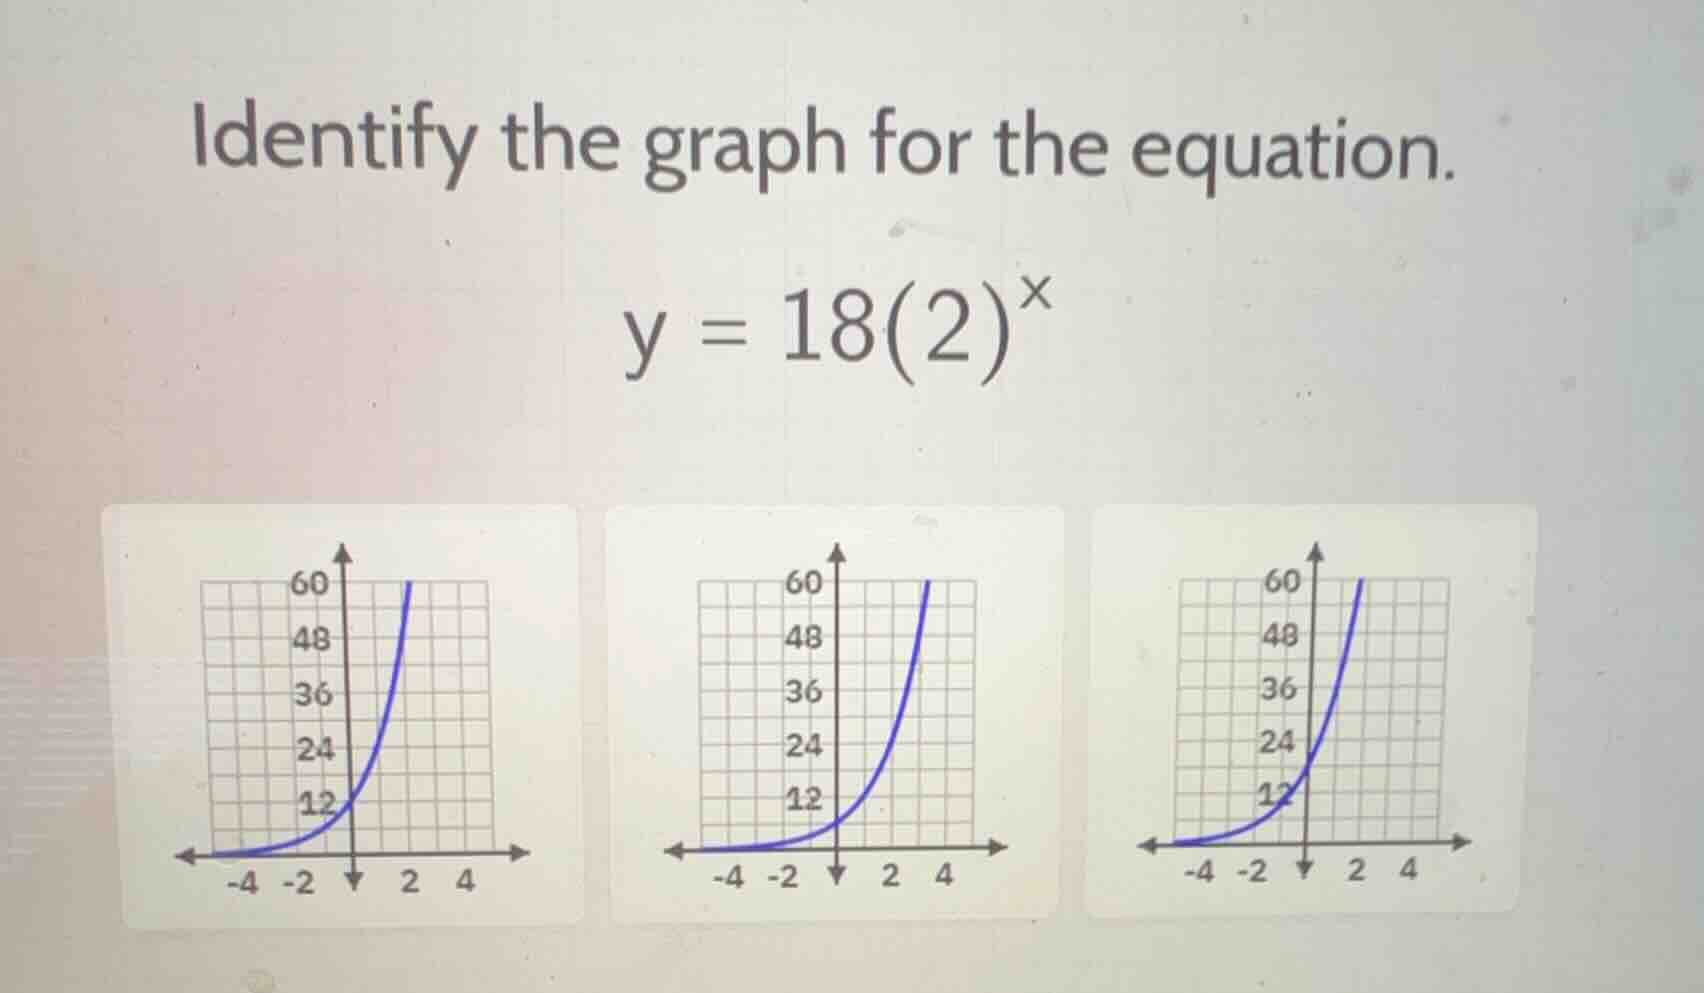
identify the graph for the equation. \n$y = 18(2)^x$
Answer
Explanation:
Step1: Find y-intercept (x=0)
Substitute $x=0$ into $y = 18(2)^x$: $y = 18(2)^0 = 18(1) = 18$
Step2: Match intercept to graphs
The y-intercept is 18, so the graph crosses the y-axis at $(0,18)$. Compare to the options:
- First graph: crosses at ~12
- Second graph: crosses at ~12
- Third graph: crosses at ~18
Step3: Verify growth trend
For $x=1$, $y=18(2)^1=36$, which matches the third graph's upward curve through $(1,36)$.
Answer:
The third graph (rightmost one, crossing the y-axis at 18 and rising steeply)