identify a graph with a given amplitude\nwhich graph has an amplitude of $\frac{1}{2}$?
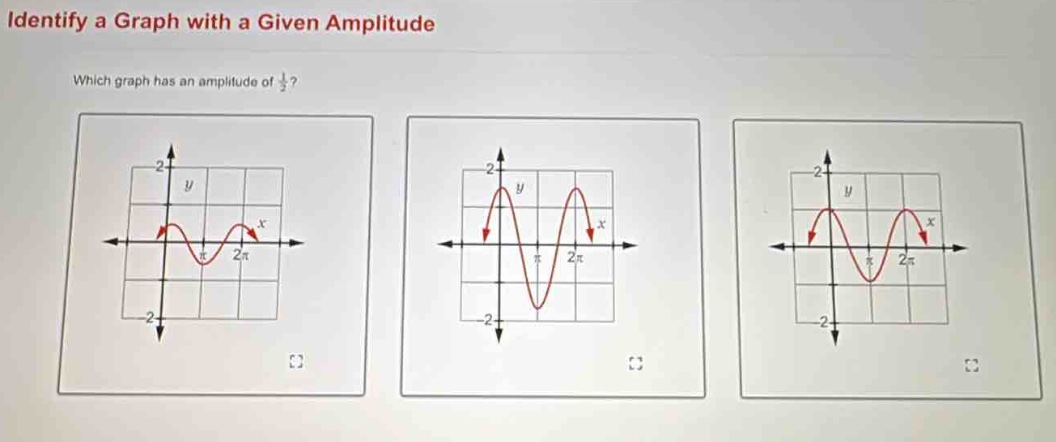
identify a graph with a given amplitude\nwhich graph has an amplitude of $\frac{1}{2}$?
Answer
Explanation:
Step1: Recall amplitude definition
The amplitude of a periodic - function (like a sine or cosine wave) is the distance from the mid - line to the maximum or minimum value of the function.
Step2: Analyze first graph
In the first graph, the maximum value above the mid - line ($y = 0$) is 1 and the minimum value below the mid - line is - 1. So the amplitude $A=1$.
Step3: Analyze second graph
In the second graph, the maximum value above the mid - line ($y = 0$) is 2 and the minimum value below the mid - line is - 2. So the amplitude $A = 2$.
Step4: Analyze third graph
In the third graph, the maximum value above the mid - line ($y = 0$) is $\frac{1}{2}$ and the minimum value below the mid - line is $-\frac{1}{2}$. So the amplitude $A=\frac{1}{2}$.
Answer:
The third graph has an amplitude of $\frac{1}{2}$.