identify the graph of $y = \\ln x + 1$.
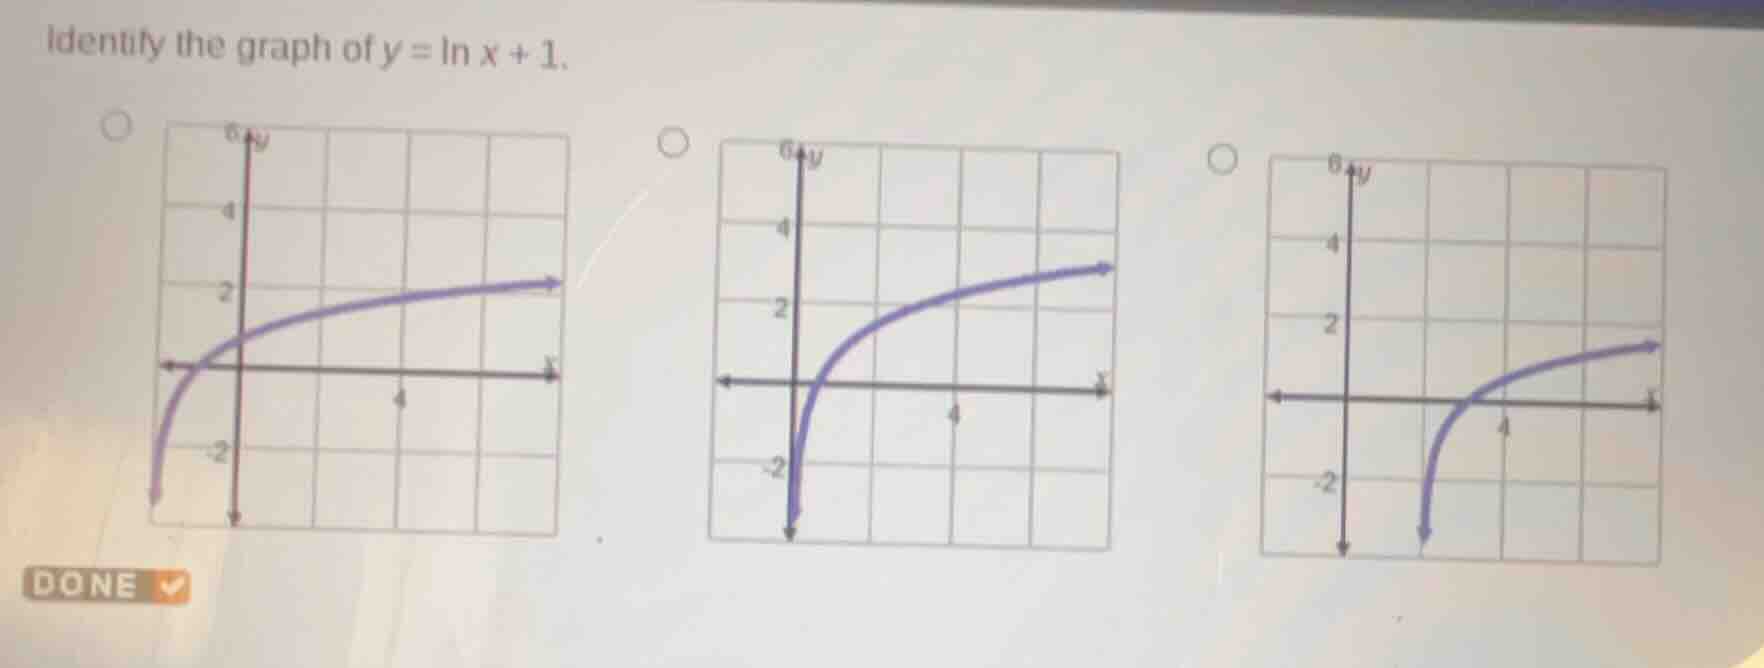
identify the graph of $y = \\ln x + 1$.
Answer
Explanation:
Step1: Recall the parent function
The parent function is ( y = \ln x ), which has a vertical asymptote at ( x = 0 ), passes through ( (1, 0) ), and is increasing for ( x>0 ).
Step2: Analyze the transformation
The function ( y=\ln x + 1 ) is a vertical shift of ( y = \ln x ) by 1 unit up. So we need to check the key points and the asymptote.
Step3: Check the vertical asymptote
For ( y=\ln x+1 ), the vertical asymptote is still ( x = 0 ) (since vertical shifts don't change the vertical asymptote of logarithmic functions).
Step4: Check the point when ( x = 1 )
When ( x = 1 ), ( y=\ln(1)+1=0 + 1=1 ). So the graph should pass through ( (1, 1) ). Also, as ( x\rightarrow0^+ ), ( \ln x\rightarrow-\infty ), so ( y=\ln x + 1\rightarrow-\infty ), and as ( x\rightarrow\infty ), ( \ln x\rightarrow\infty ), so ( y\rightarrow\infty ).
Now let's analyze the options:
- First graph: The curve is on the left of ( y )-axis ( ( x<0 ) ) which is not possible for ( y = \ln x+1 ) (domain ( x>0 )), so eliminate.
- Second graph: Vertical asymptote at ( x = 0 ), passes near ( (1, 1) ) (since when ( x = 1 ), ( y = 1 )), and is increasing for ( x>0 ), which matches.
- Third graph: Vertical asymptote is at ( x = 4 ) (or some ( x>1 )), which is wrong as the asymptote should be ( x = 0 ), so eliminate.