(identifying functions hc)\nthe graph shows the distance, in miles, keandra traveled from her home over a…
(identifying functions hc)\nthe graph shows the distance, in miles, keandra traveled from her home over a certain amount of time, in minutes.\npart a: identify the interval(s) where the graph is increasing, decreasing, and constant. (2 points)\npart b: write a detailed description for the graph using information from part a. (2 points)
Answer
Explanation:
Step1: Identify increasing interval
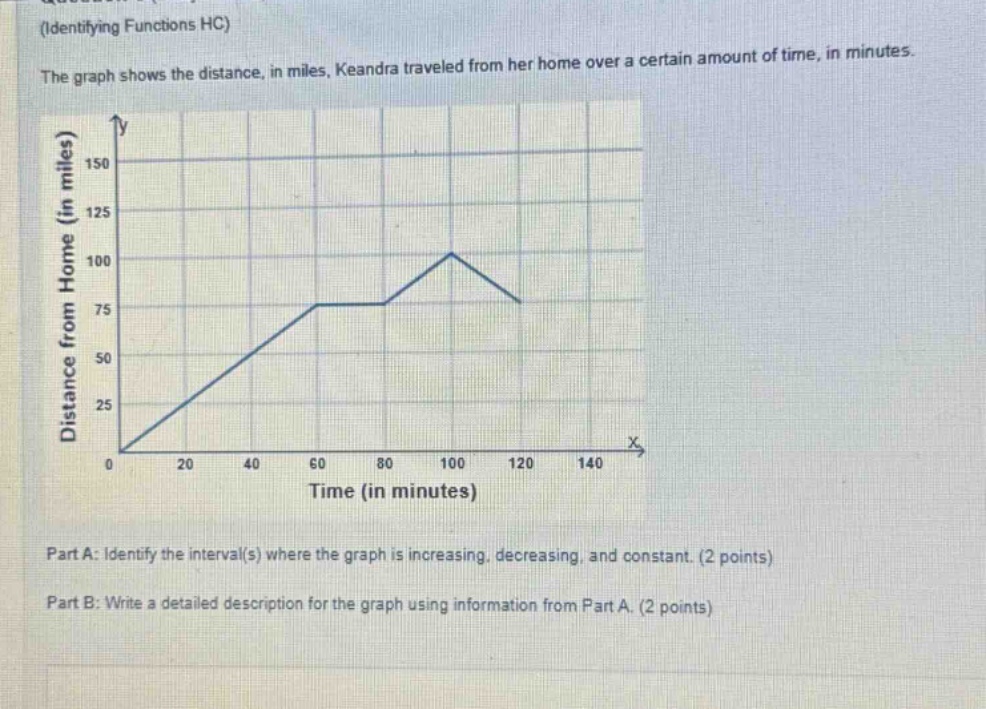
The graph rises when the distance from home increases with time. From the graph, the increasing interval is $0\leq x\leq60$ and $80 < x\leq100$.
Step2: Identify decreasing interval
The graph falls when the distance from home decreases with time. The decreasing interval is $100 < x\leq120$.
Step3: Identify constant interval
The graph is flat when the distance from home does not change with time. The constant interval is $60 < x\leq80$.
Step4: Write detailed description
The graph starts at the origin, indicating Keandra starts from home. It increases steadily from $x = 0$ to $x=60$ minutes, meaning she is moving away from home. Then it remains constant from $x = 60$ to $x = 80$ minutes, indicating she stops moving. After that, it increases again from $x=80$ to $x = 100$ minutes, moving further away. Finally, it decreases from $x = 100$ to $x=120$ minutes, suggesting she is moving back towards home.
Answer:
Part A: Increasing intervals: $0\leq x\leq60$ and $80 < x\leq100$; Decreasing interval: $100 < x\leq120$; Constant interval: $60 < x\leq80$ Part B: The graph starts at the origin. It increases from $x = 0$ to $x = 60$, is constant from $x = 60$ to $x = 80$, increases again from $x=80$ to $x = 100$, and then decreases from $x = 100$ to $x=120$.