international practice exam ab mcq, part b - calculator required\n11 mark for review\nwhich of the following…
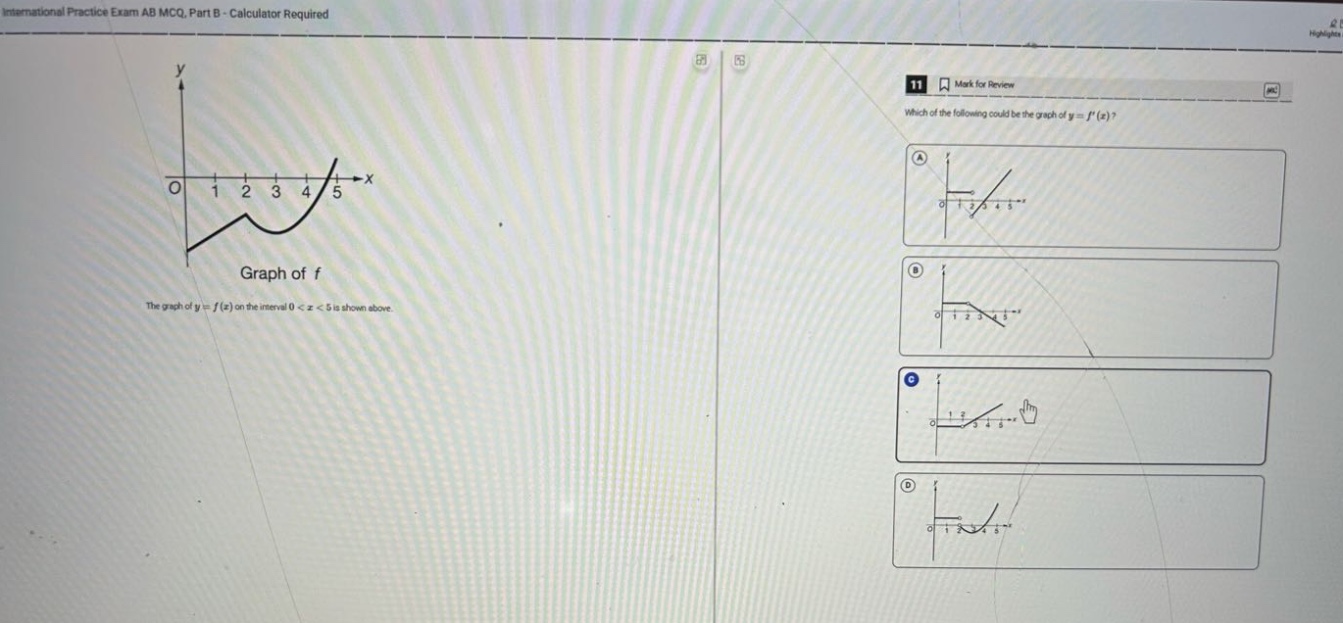
international practice exam ab mcq, part b - calculator required\n11 mark for review\nwhich of the following could be the graph of y = f(x)?\nthe graph of y = f(x) on the interval 0 < x < 5 is shown above.
Answer
Explanation:
Step1: Recall derivative - function relationship
The derivative (y = f'(x)) represents the slope of the tangent line to (y=f(x)). When (f(x)) is increasing, (f'(x)>0); when (f(x)) is decreasing, (f'(x)<0); and when (f(x)) has a horizontal tangent, (f'(x) = 0).
Step2: Analyze the graph of (y = f(x))
The function (y = f(x)) is increasing on the interval ((0,2)), so (f'(x)>0) on ((0,2)). It has a horizontal tangent (a local - maximum) at (x = 2), so (f'(2)=0). Then (f(x)) is decreasing on the interval ((2,3)), so (f'(x)<0) on ((2,3)). After (x = 3), (f(x)) is increasing again, so (f'(x)>0) on ((3,5)).
Step3: Match with the options
Option C shows (y=f'(x)) being positive on ((0,2)), zero at (x = 2), negative on ((2,3)) and positive on ((3,5)).
Answer:
C.