jenna throws a stone off a pier and into the ocean. the graph models how the height of the stone, above sea…
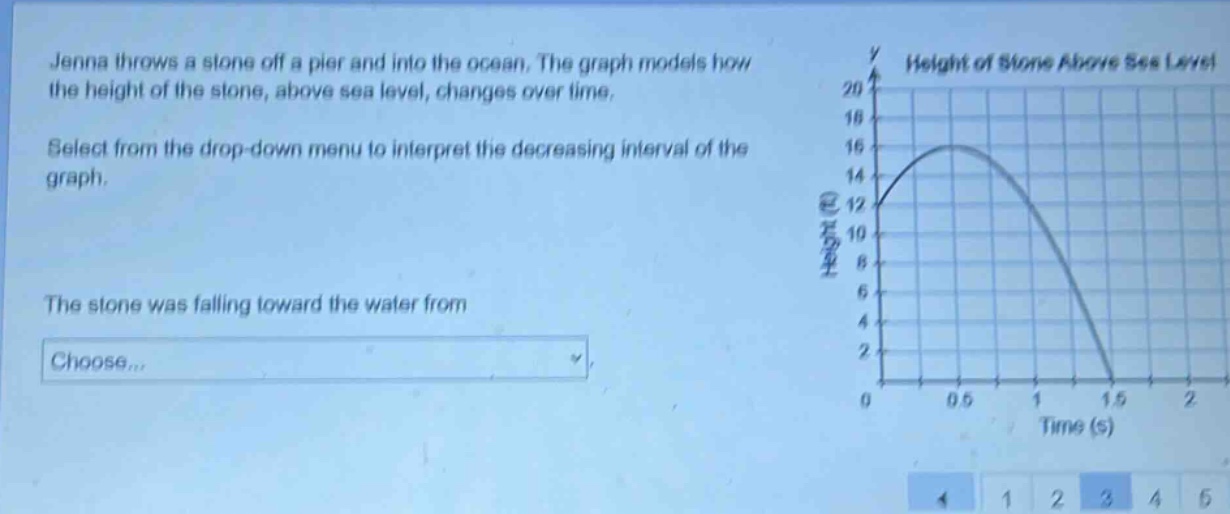
jenna throws a stone off a pier and into the ocean. the graph models how the height of the stone, above sea level, changes over time. select from the drop - down menu to interpret the decreasing interval of the graph. the stone was falling toward the water from choose...
Answer
Explanation:
Step1: Identify the decreasing part of the graph
The graph starts to decrease after reaching its maximum height. Looking at the time - axis, the maximum height occurs around (t = 0.5) s and the stone hits the water at (t=1.5) s.
Step2: Determine the time - interval of decrease
The stone is falling (height is decreasing) from (t = 0.5) s to (t = 1.5) s.
Answer:
0.5 s to 1.5 s