locating local maximum and minimum function values\nuse the graphing tool to find the local minimum and the…
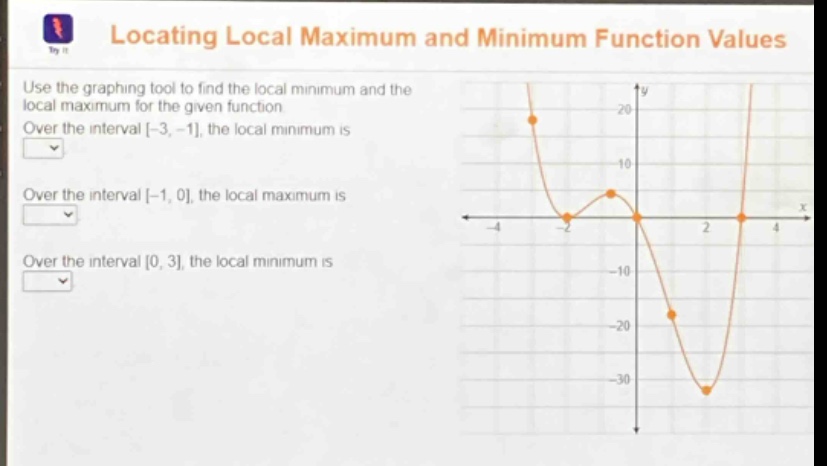
locating local maximum and minimum function values\nuse the graphing tool to find the local minimum and the local maximum for the given function\nover the interval -3, -1, the local minimum is\nover the interval -1, 0, the local maximum is\nover the interval 0, 3, the local minimum is
Answer
Explanation:
Step1: Analyze interval [-3, -1]
By observing the graph, in the interval [-3, -1], the function value at $x=-1$ is the lowest. The value of the function at $x = - 1$ is $y = 0$.
Step2: Analyze interval [-1, 0]
In the interval [-1, 0], the function value at $x=0$ is the highest. The value of the function at $x = 0$ is $y = 0$.
Step3: Analyze interval [0, 3]
In the interval [0, 3], the function value at $x = 2$ is the lowest. The value of the function at $x=2$ is $y=-30$.
Answer:
Over the interval [-3, -1], the local minimum is $0$. Over the interval [-1, 0], the local maximum is $0$. Over the interval [0, 3], the local minimum is $-30$.