look at the graph and the table of values below. calculate the average rate of change, to the nearest tenth…
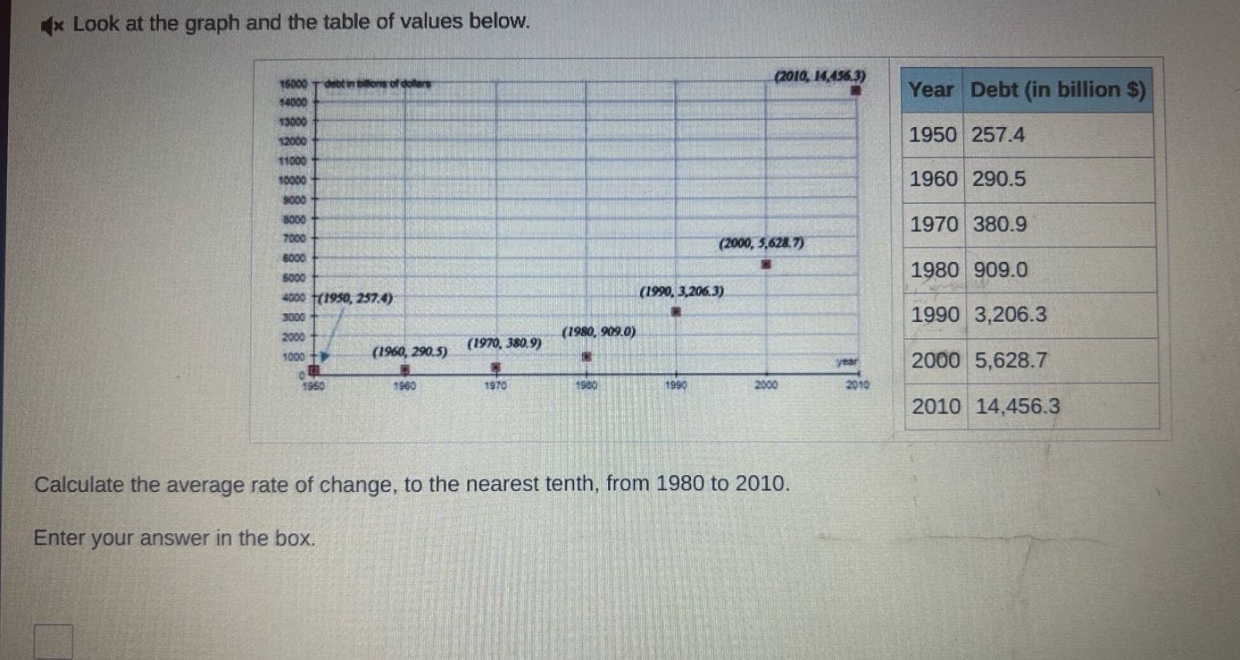
look at the graph and the table of values below. calculate the average rate of change, to the nearest tenth, from 1980 to 2010. enter your answer in the box.
Answer
Explanation:
Step1: Identify the formula for average rate of change
The formula for the average rate of change of a function $y = f(x)$ from $x_1$ to $x_2$ is $\frac{f(x_2)-f(x_1)}{x_2 - x_1}$. Here, $x$ is the year and $y$ is the debt. $x_1 = 1980$, $y_1=909.0$, $x_2 = 2010$, $y_2 = 14456.3$.
Step2: Substitute the values into the formula
$\frac{y_2 - y_1}{x_2 - x_1}=\frac{14456.3 - 909.0}{2010 - 1980}$ $=\frac{13547.3}{30}$
Step3: Calculate the result
$\frac{13547.3}{30}\approx451.6$
Answer:
$451.6$