3. make sense and persevere demi went for a run in the park. the graph shows her speed during the run. a…
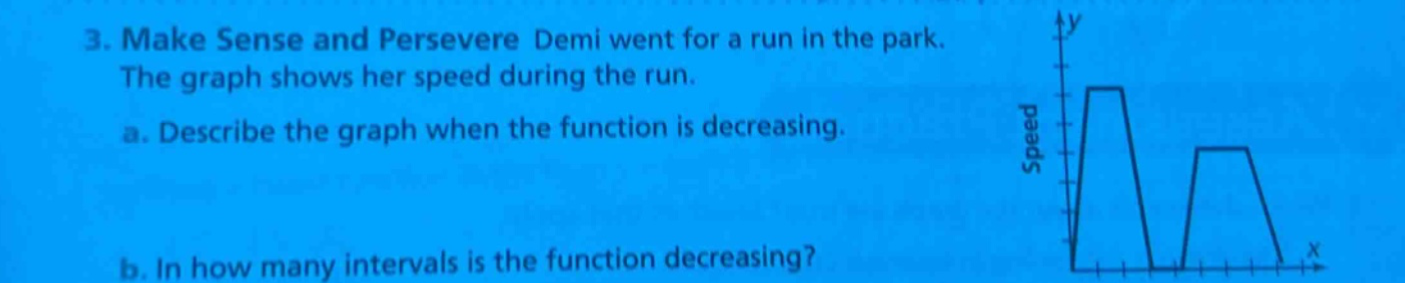
3. make sense and persevere demi went for a run in the park. the graph shows her speed during the run. a. describe the graph when the function is decreasing. b. in how many intervals is the function decreasing?
Answer
Explanation:
Step1: Analyze decreasing - part of graph
When a function is decreasing, the y - value (speed in this case) decreases as the x - value increases. Looking at the graph, the speed is decreasing when the graph is sloping downwards.
Step2: Count decreasing intervals
We observe the graph to find the number of times the graph slopes downwards. Each sloping - down part represents an interval where the function is decreasing.
Answer:
a. The graph is sloping downwards when the function is decreasing, which means the speed is decreasing as time (represented on the x - axis) is increasing. b. 2