malik throws a ball up in the air. the graph below shows the height of the ball ( h ) in meters after ( t )…
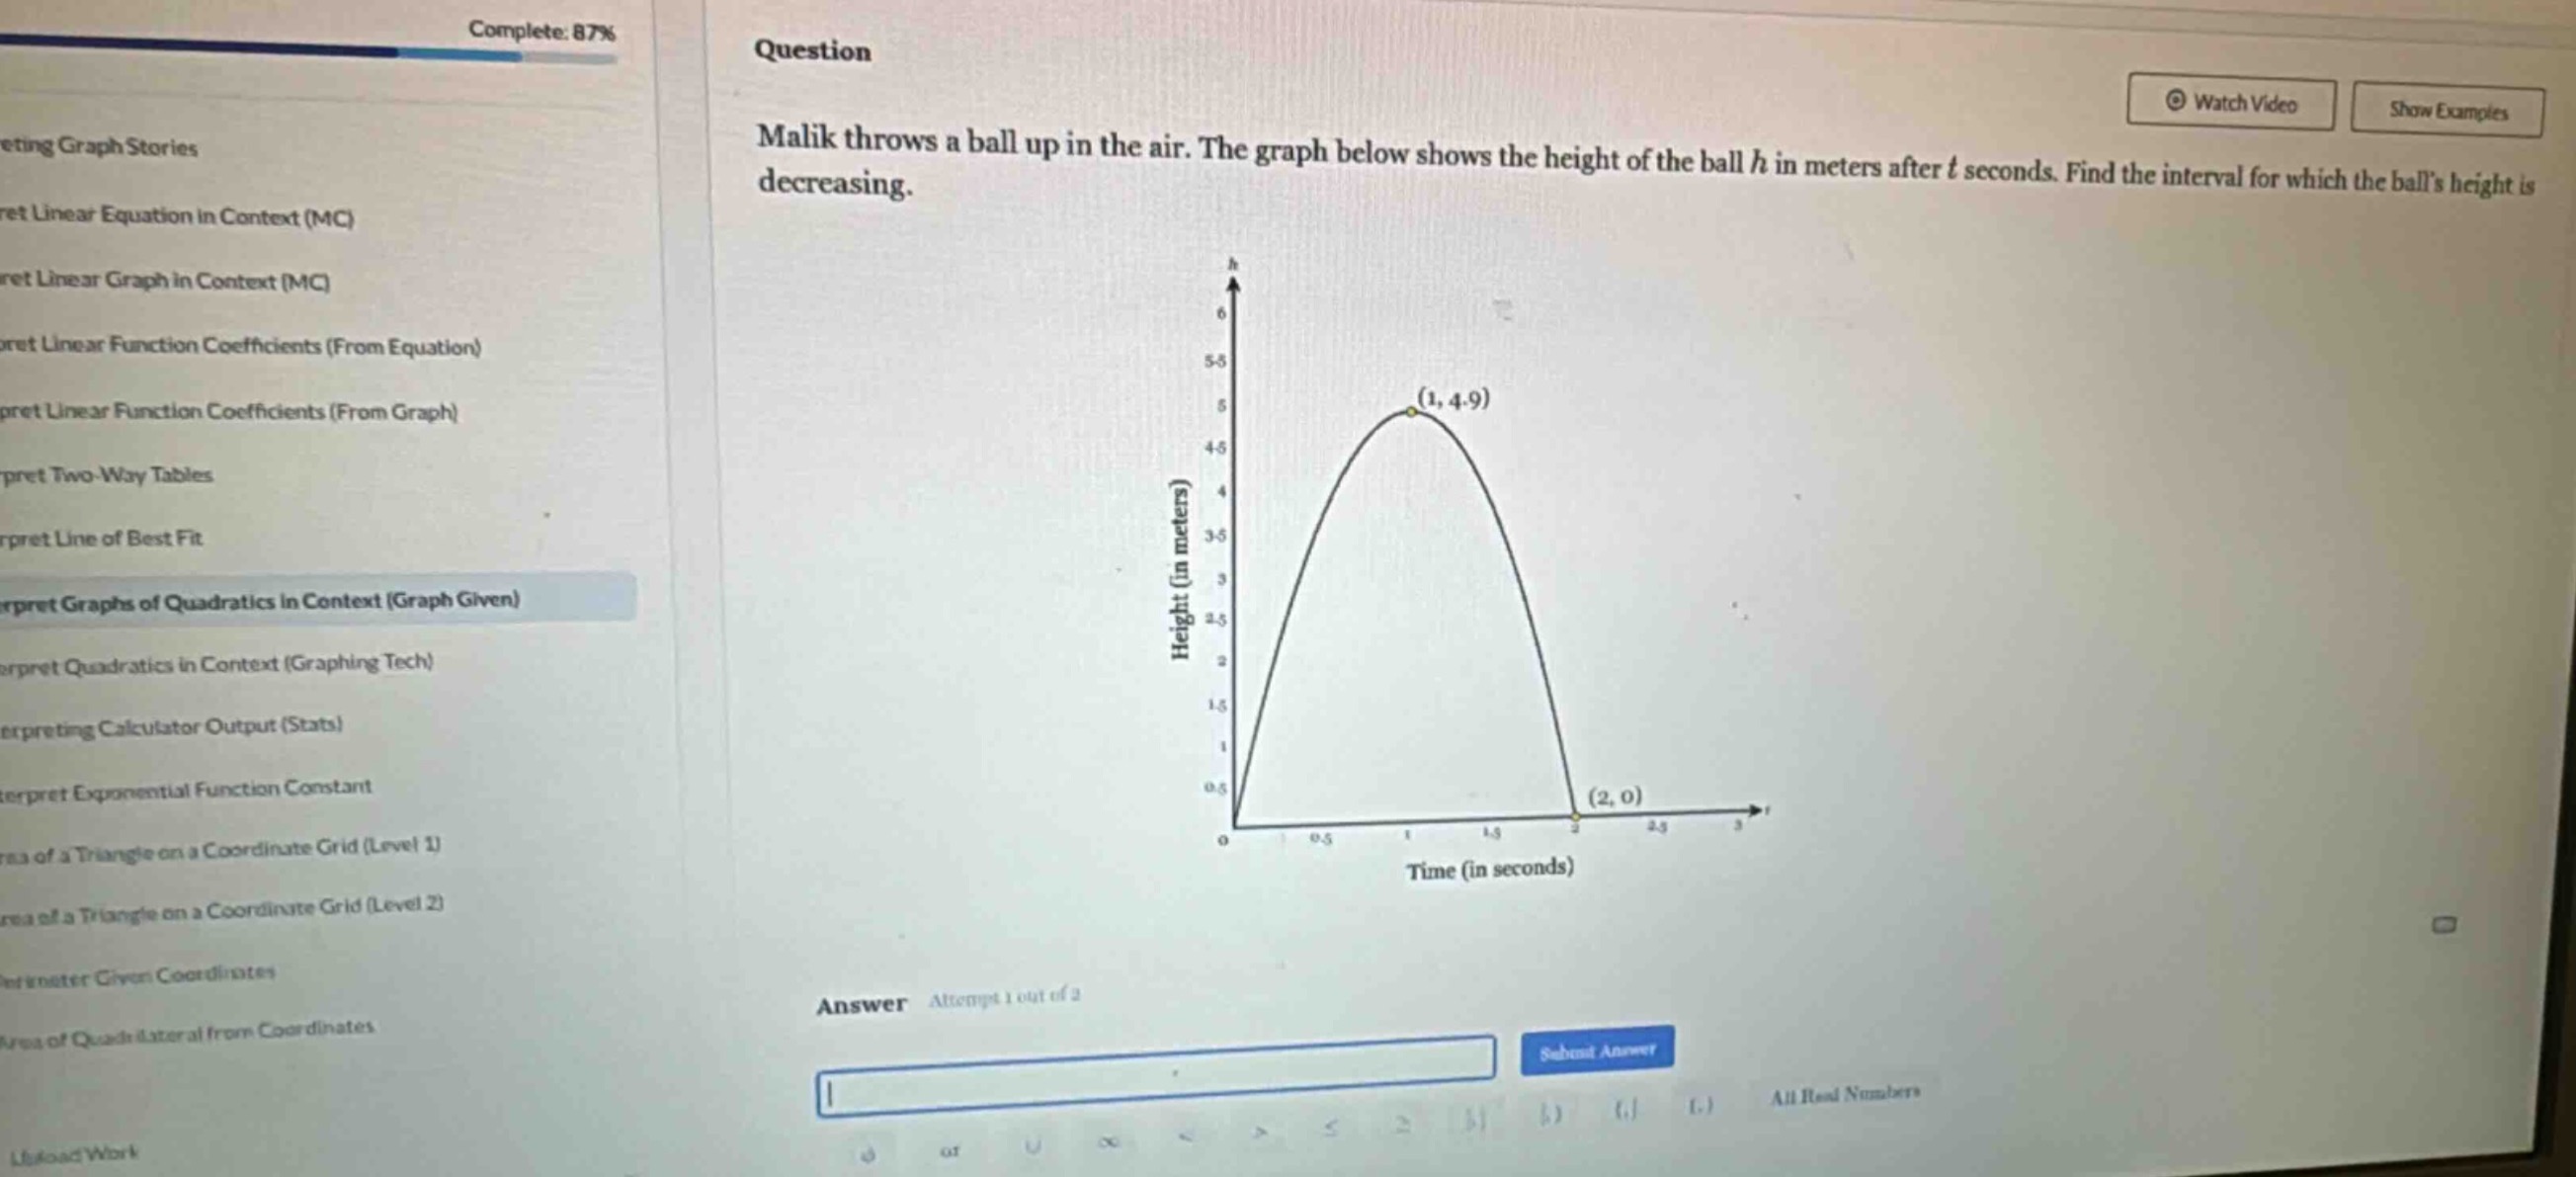
malik throws a ball up in the air. the graph below shows the height of the ball ( h ) in meters after ( t ) seconds. find the interval for which the balls height is decreasing.
Answer
Explanation:
Step1: Understand the concept of increasing and decreasing intervals
For a function (y = f(x)), if as (x) increases, (y) also increases, the function is increasing. If as (x) increases, (y) decreases, the function is decreasing. In the context of the height - time graph ((h(t))), we look at the behavior of the graph.
Step2: Analyze the given graph
The vertex of the parabola (which represents the height of the ball as a function of time) is at the point ((1,4.9)). For a parabola opening downwards (since the ball goes up and then comes down), the function is increasing to the left of the vertex and decreasing to the right of the vertex. The domain of the function (since the height of the ball (h(t)\geq0)) is from (t = 0) to (t=2). As (t) moves from (t = 1) to (t = 2), the height (h) of the ball is decreasing.
Answer:
((1,2))