mark sits on a swing that is 2.5 feet off the ground. swinging as hard as he can, the swing reaches a height…
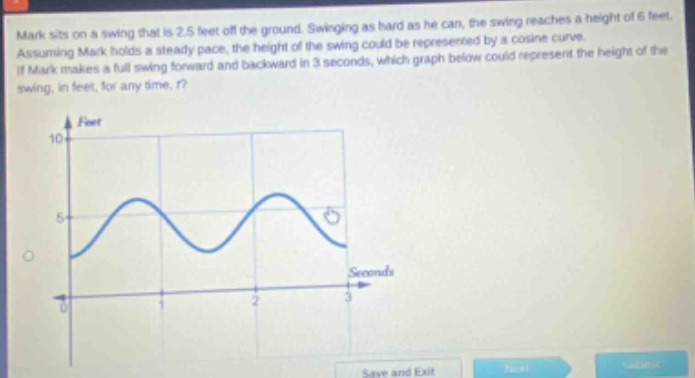
mark sits on a swing that is 2.5 feet off the ground. swinging as hard as he can, the swing reaches a height of 6 feet. assuming mark holds a steady pace, the height of the swing could be represented by a cosine curve. if mark makes a full swing forward and backward in 3 seconds, which graph below could represent the height of the swing, in feet, for any time, t?
Answer
Explanation:
Step1: Determine amplitude
The swing starts at 2.5 feet and reaches 6 feet. The amplitude $A$ is half of the vertical distance between the maximum and minimum values. The maximum is 6 feet and the minimum is 2.5 feet. So the vertical distance is $6 - 2.5=3.5$ feet, and the amplitude $A=\frac{6 - 2.5}{2}=\frac{3.5}{2}=1.75$ feet.
Step2: Determine vertical - shift
The mid - line of the cosine function (average of maximum and minimum) gives the vertical shift $D$. $D=\frac{6 + 2.5}{2}=\frac{8.5}{2}=4.25$ feet.
Step3: Determine period and angular frequency
The period $T$ is the time for one full swing, which is $T = 3$ seconds. The angular frequency $\omega=\frac{2\pi}{T}=\frac{2\pi}{3}$. The general form of a cosine function is $y = A\cos(\omega t)+D$. Substituting the values we found: $y = 1.75\cos(\frac{2\pi}{3}t)+4.25$. When $t = 0$, $y=1.75\cos(0)+4.25=1.75\times1 + 4.25=6$ (the maximum height at the start of the swing makes sense as he starts swinging from the highest point).
We need to analyze the graph based on these characteristics. The graph should start at the maximum value (since he starts swinging from the highest point), have a period of 3 seconds, an amplitude of 1.75 and a mid - line at $y = 4.25$.
Answer:
The graph that starts at the maximum value (at $t = 0$), has a period of 3 seconds (repeats every 3 seconds), has an amplitude such that the maximum is 6 and minimum is 2.5 (mid - line at $y=4.25$) is the correct one. Without seeing all the options, we can't specifically identify which one it is from the description given in the problem - but it should have these characteristics.