match equation graph with its parametric equation. not all equations will be used. all graphs shown for -5 ≤…
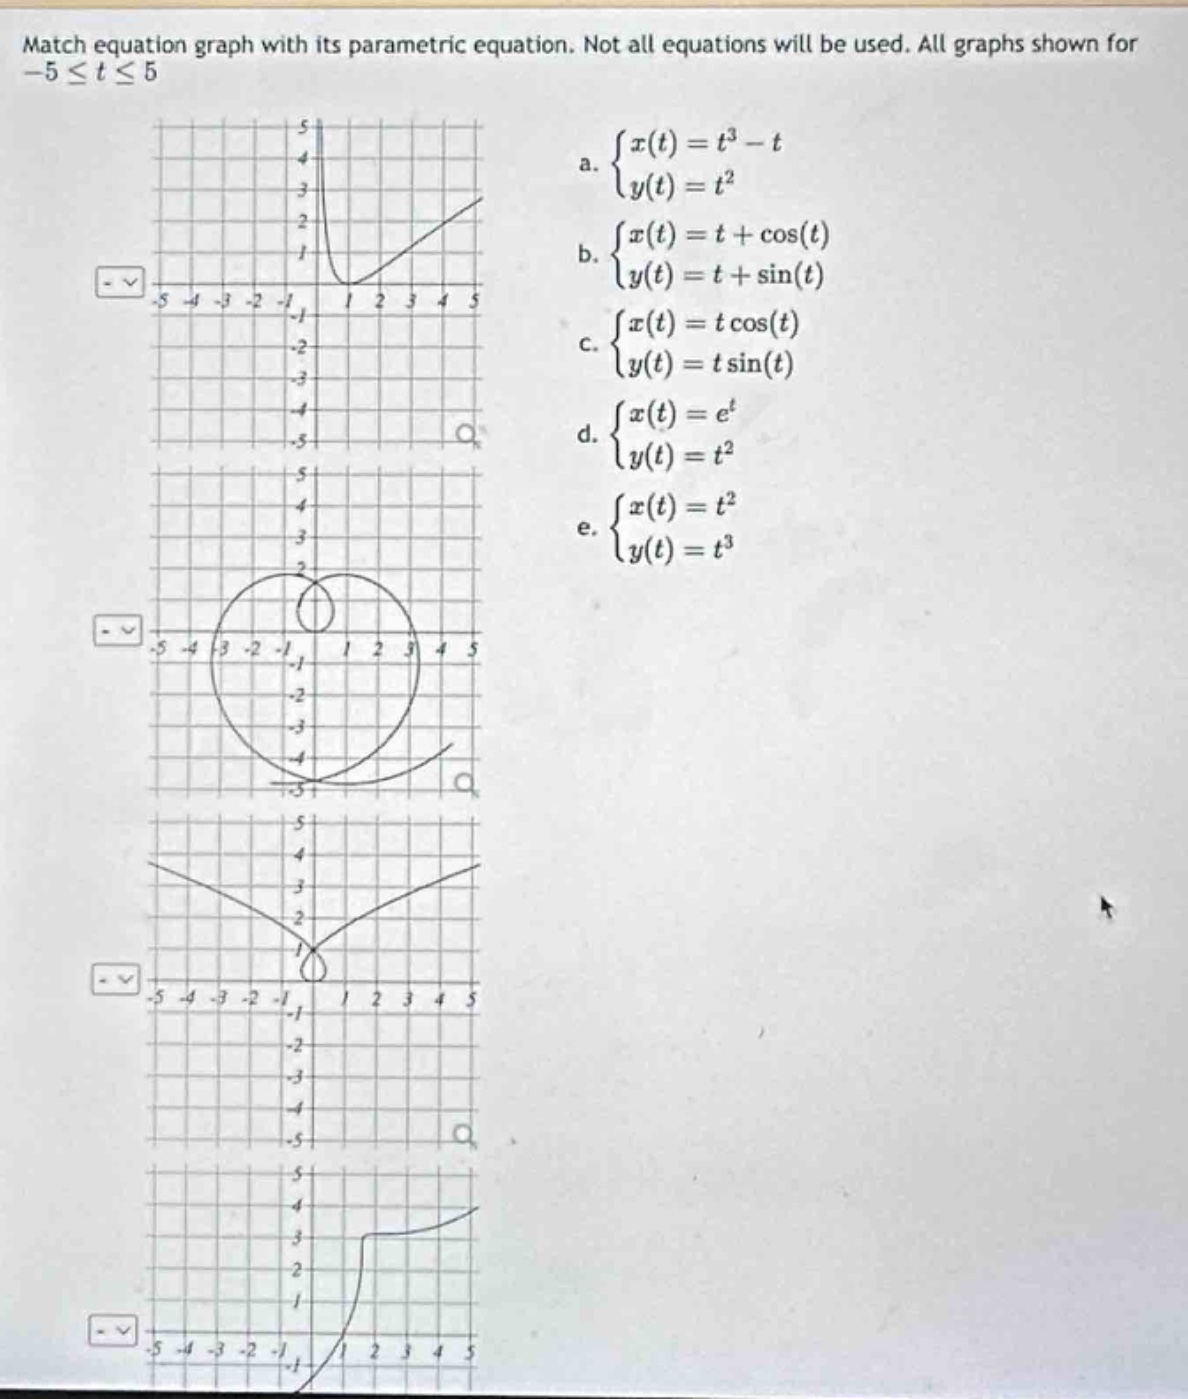
match equation graph with its parametric equation. not all equations will be used. all graphs shown for -5 ≤ t ≤ 5\na. $\begin{cases}x(t)=t^{3}-t\\y(t)=t^{2}end{cases}$\nb. $\begin{cases}x(t)=t + cos(t)\\y(t)=t+sin(t)end{cases}$\nc. $\begin{cases}x(t)=tcos(t)\\y(t)=tsin(t)end{cases}$\nd. $\begin{cases}x(t)=e^{t}\\y(t)=t^{2}end{cases}$\ne. $\begin{cases}x(t)=t^{2}\\y(t)=t^{3}end{cases}$
Answer
Explanation:
Step1: Analyze parametric - equation a
For $\left{\begin{array}{l}x(t)=t^{3}-t\y(t)=t^{2}\end{array}\right.$, when $t = 0$, $x(0)=0$ and $y(0)=0$. The function $y(t)=t^{2}\geq0$ for all real - valued $t$. The derivative of $x(t)$ with respect to $t$ is $x^\prime(t)=3t^{2}-1$, and the derivative of $y(t)$ with respect to $t$ is $y^\prime(t) = 2t$. The slope of the curve $\frac{dy}{dx}=\frac{y^\prime(t)}{x^\prime(t)}=\frac{2t}{3t^{2}-1}$.
Step2: Analyze parametric - equation b
For $\left{\begin{array}{l}x(t)=t+\cos(t)\y(t)=t+\sin(t)\end{array}\right.$, as $t$ varies, this represents a curve that is a combination of linear and trigonometric functions. The derivatives $x^\prime(t)=1 - \sin(t)$ and $y^\prime(t)=1+\cos(t)$.
Step3: Analyze parametric - equation c
For $\left{\begin{array}{l}x(t)=t\cos(t)\y(t)=t\sin(t)\end{array}\right.$, we know that $x^{2}(t)+y^{2}(t)=t^{2}\cos^{2}(t)+t^{2}\sin^{2}(t)=t^{2}$. This is a spiral - like curve. When $t = 0$, $x(0)=0$ and $y(0)=0$. As $t$ increases, the distance from the origin $\sqrt{x^{2}+y^{2}}=\vert t\vert$.
Step4: Analyze parametric - equation d
For $\left{\begin{array}{l}x(t)=e^{t}\y(t)=t^{2}\end{array}\right.$, since $x(t)=e^{t}>0$ for all real $t$, the curve exists only in the right - hand side of the $y$ - axis.
Step5: Analyze parametric - equation e
For $\left{\begin{array}{l}x(t)=t^{2}\y(t)=t^{3}\end{array}\right.$, we can eliminate the parameter $t$. From $x = t^{2}$, we have $t=\pm\sqrt{x}$ (for $x\geq0$), and $y = t^{3}=\pm x^{\frac{3}{2}}$.
Without seeing the specific graphs clearly, we can make some general observations:
- The parametric equations $\left{\begin{array}{l}x(t)=t\cos(t)\y(t)=t\sin(t)\end{array}\right.$ will form a spiral - like shape centered at the origin, which may match a graph with a circular - like or spiral pattern.
- The parametric equations $\left{\begin{array}{l}x(t)=t^{2}\y(t)=t^{3}\end{array}\right.$ will form a semi - cubic parabola. Since $x = t^{2}\geq0$, the curve is symmetric about the $y$ - axis in a certain sense.
- The parametric equations $\left{\begin{array}{l}x(t)=e^{t}\y(t)=t^{2}\end{array}\right.$ will have the curve only on the right - hand side of the $y$ - axis because $x = e^{t}>0$.
- The parametric equations $\left{\begin{array}{l}x(t)=t^{3}-t\y(t)=t^{2}\end{array}\right.$: The $y$ - values are non - negative ($y = t^{2}\geq0$), and the $x$ - values have critical points from $x^\prime(t)=3t^{2}-1 = 0$, so $t=\pm\frac{1}{\sqrt{3}}$.
- The parametric equations $\left{\begin{array}{l}x(t)=t+\cos(t)\y(t)=t+\sin(t)\end{array}\right.$ represent a curve that moves in a non - circular, non - parabolic way as $t$ varies.
We need to match the graphs with the above - described characteristics. But if we assume the first graph (top - most) has a non - circular, non - spiral shape with $y\geq0$ for all $t$ in the domain, it may match $\left{\begin{array}{l}x(t)=t^{3}-t\y(t)=t^{2}\end{array}\right.$; the second graph (with a circular - like or spiral pattern) may match $\left{\begin{array}{l}x(t)=t\cos(t)\y(t)=t\sin(t)\end{array}\right.$; the third graph (symmetric about the $y$ - axis and a non - linear shape) may match $\left{\begin{array}{l}x(t)=t^{2}\y(t)=t^{3}\end{array}\right.$; the fourth graph (right - hand side of the $y$ - axis) may match $\left{\begin{array}{l}x(t)=e^{t}\y(t)=t^{2}\end{array}\right.$.
Since the graphs are not clearly labeled, we assume:
- If the first graph has $y\geq0$ and a non - circular non - spiral shape, the answer is a.
- If the second graph is a spiral - like shape, the answer is c.
- If the third graph is a semi - cubic parabola - like shape, the answer is e.
- If the fourth graph is on the right - hand side of the $y$ - axis, the answer is d.
Let's assume we have four graphs from top to bottom:
- For a graph with $y\geq0$ and a non - circular non - spiral shape:
Answer:
a. $\left{\begin{array}{l}x(t)=t^{3}-t\y(t)=t^{2}\end{array}\right.$ 2. For a spiral - like graph:
Answer:
c. $\left{\begin{array}{l}x(t)=t\cos(t)\y(t)=t\sin(t)\end{array}\right.$ 3. For a semi - cubic parabola - like graph:
Answer:
e. $\left{\begin{array}{l}x(t)=t^{2}\y(t)=t^{3}\end{array}\right.$ 4. For a graph on the right - hand side of the $y$ - axis:
Answer:
d. $\left{\begin{array}{l}x(t)=e^{t}\y(t)=t^{2}\end{array}\right.$