match each exponential function to its graph.\n$m(x) = 0.2(5)^x$\n$t(x) = 1.2(2)^x$\n$k(x) =…
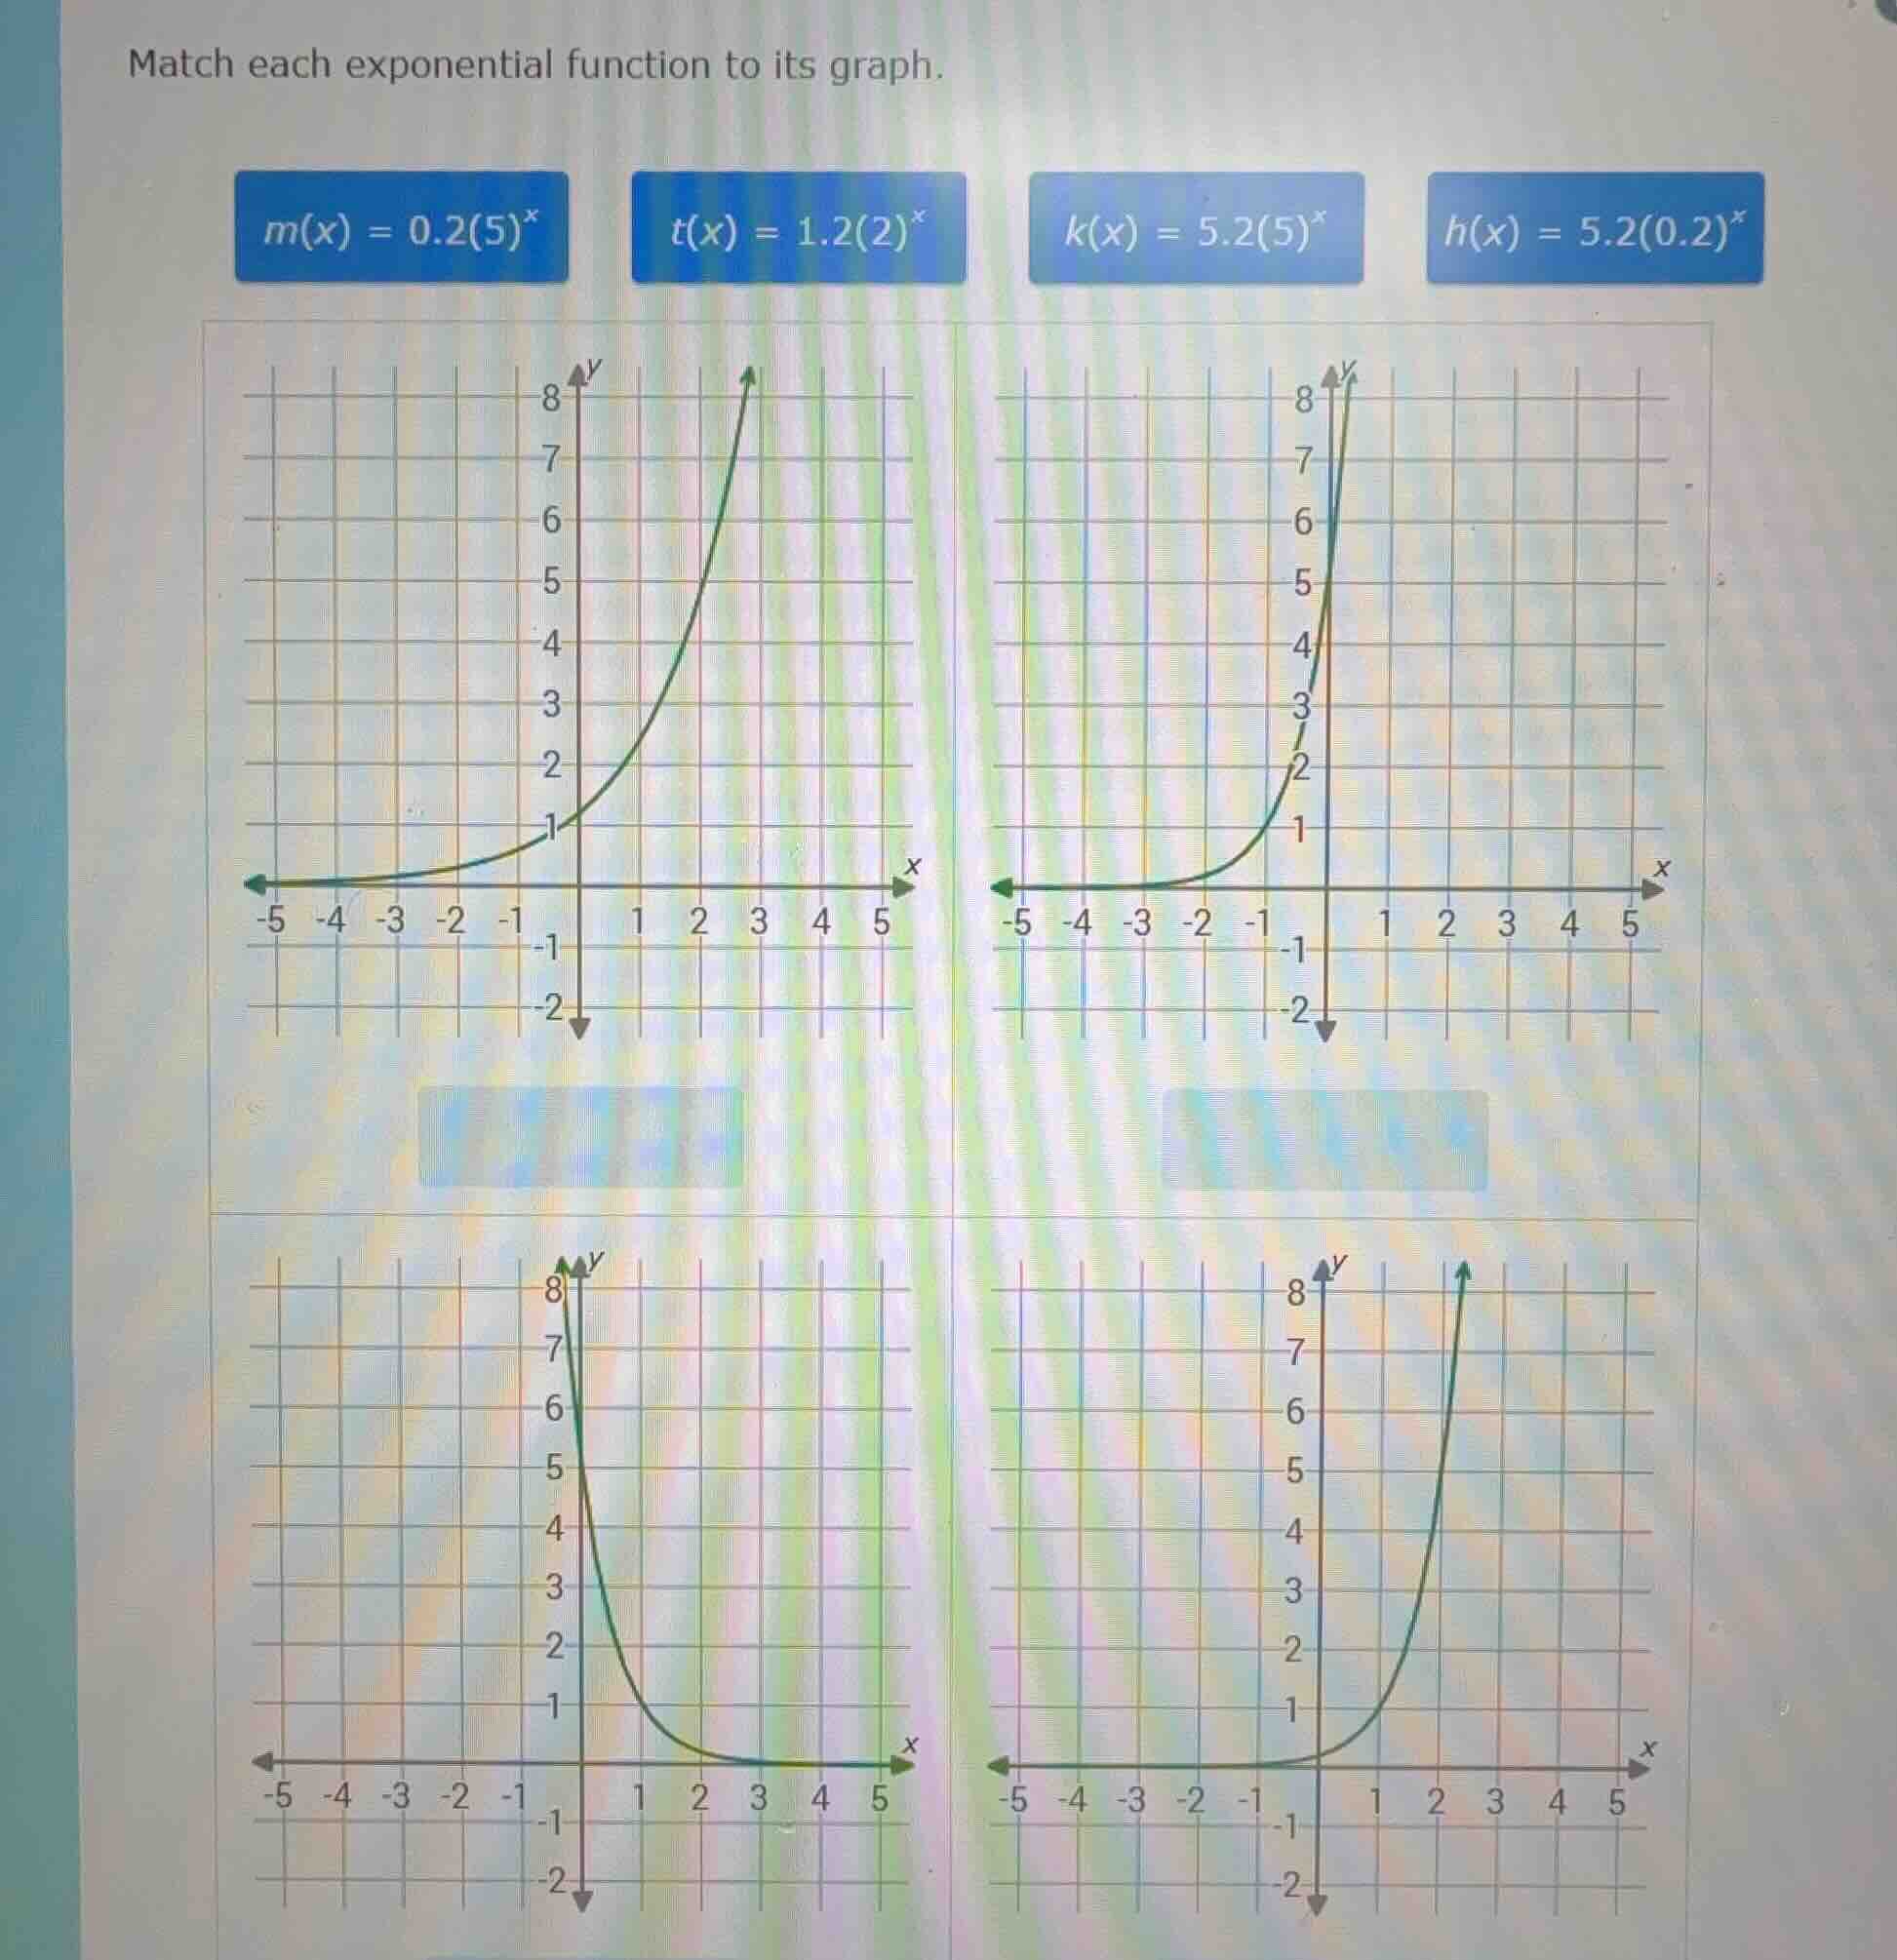
match each exponential function to its graph.\n$m(x) = 0.2(5)^x$\n$t(x) = 1.2(2)^x$\n$k(x) = 5.2(5)^x$\n$h(x) = 5.2(0.2)^x$
Answer
Answer:
$m(x) = 0.2(5)^x$ matches with the bottom right graph. $t(x) = 1.2(2)^x$ matches with the top left graph. $k(x) = 5.2(5)^x$ matches with the top right graph. $h(x) = 5.2(0.2)^x$ matches with the bottom left graph.
Explanation:
Step1: Understand exponential function form
An exponential function is generally in the form $y = a \cdot b^x$. Here, $a$ is the y-intercept (when $x=0$, $y=a$), and $b$ is the growth/decay factor. If $b > 1$, the function represents exponential growth. If $0 < b < 1$, the function represents exponential decay.
Step2: Analyze $m(x) = 0.2(5)^x$
For $m(x) = 0.2(5)^x$: The y-intercept is $0.2$ (since $m(0) = 0.2(5)^0 = 0.2 \cdot 1 = 0.2$). The base is $5$, which is greater than $1$, so it's an exponential growth function. Looking at the graphs, the bottom right graph shows growth and passes through $y=0.2$ (approximately) when $x=0$.
Step3: Analyze $t(x) = 1.2(2)^x$
For $t(x) = 1.2(2)^x$: The y-intercept is $1.2$ (since $t(0) = 1.2(2)^0 = 1.2 \cdot 1 = 1.2$). The base is $2$, which is greater than $1$, so it's an exponential growth function. Looking at the graphs, the top left graph shows growth and passes through $y=1.2$ when $x=0$.
Step4: Analyze $k(x) = 5.2(5)^x$
For $k(x) = 5.2(5)^x$: The y-intercept is $5.2$ (since $k(0) = 5.2(5)^0 = 5.2 \cdot 1 = 5.2$). The base is $5$, which is greater than $1$, so it's an exponential growth function. Looking at the graphs, the top right graph shows growth and passes through $y=5.2$ when $x=0$.
Step5: Analyze $h(x) = 5.2(0.2)^x$
For $h(x) = 5.2(0.2)^x$: The y-intercept is $5.2$ (since $h(0) = 5.2(0.2)^0 = 5.2 \cdot 1 = 5.2$). The base is $0.2$, which is between $0$ and $1$, so it's an exponential decay function. Looking at the graphs, the bottom left graph shows decay and passes through $y=5.2$ when $x=0$.