match the graph of the function on the right with the graph of its derivative. choose the correct graph of…
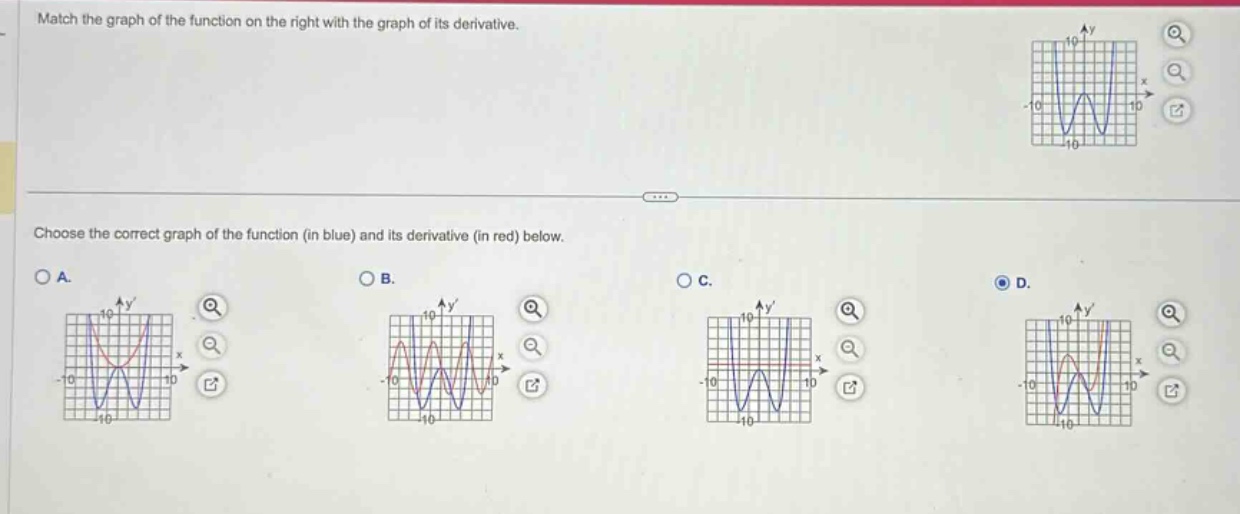
match the graph of the function on the right with the graph of its derivative. choose the correct graph of the function (in blue) and its derivative (in red) below. a. b. c. d.
Answer
Explanation:
Step1: Recall derivative - graph relationship
The derivative of a function gives the slope of the tangent line to the function at each point. When the function is increasing, the derivative is positive; when decreasing, negative; and at local extrema (peaks and valleys), the derivative is zero.
Step2: Analyze the given function graph
The given function has multiple local maxima and minima. At local maxima and minima, the derivative graph should cross the x - axis (y = 0). Also, when the function is increasing, the derivative is above the x - axis and when decreasing, below the x - axis.
Step3: Check each option
- Option A: The derivative graph does not correctly represent the increasing and decreasing intervals and extrema of the function graph.
- Option B: The derivative graph does not match the number of extrema and the behavior of the function graph in terms of increasing and decreasing intervals.
- Option C: The derivative graph does not match the shape and behavior of the function graph in terms of where the function is increasing and decreasing.
- Option D: The red - colored derivative graph correctly shows positive values when the blue - colored function graph is increasing, negative values when the function graph is decreasing, and crosses the x - axis at the local extrema of the function graph.
Answer:
D.