move the graphs that represent f(x) and g(x) into the table. function graph f(x)=3lnx g(x)=log3x
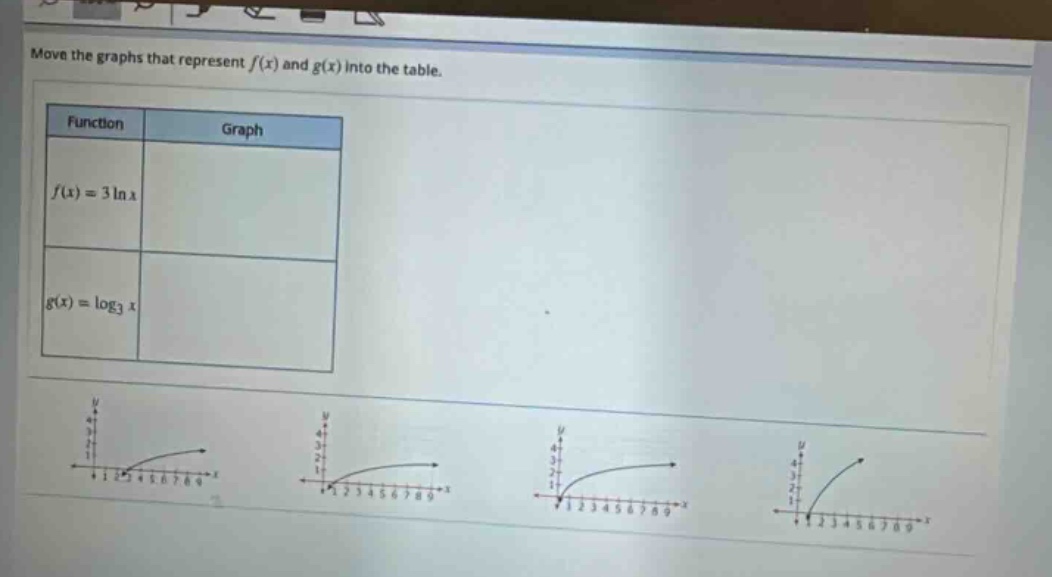
move the graphs that represent f(x) and g(x) into the table. function graph f(x)=3lnx g(x)=log3x
Answer
Explanation:
Step1: Recall properties of logarithmic functions
The function $y = a\ln x$ ($a>0$) and $y=\log_{b}x$ ($b > 1$) are increasing - functions. The natural - logarithm function $y = \ln x$ has the base $e\approx2.718$. The function $f(x)=3\ln x$ is a vertical stretch of the function $y = \ln x$ by a factor of 3. The function $g(x)=\log_{3}x$ has base $b = 3$.
Step2: Analyze the growth rate
For large values of $x$, the function $y = 3\ln x$ will grow faster than $y=\log_{3}x$. The general form of the change - of - base formula for logarithms is $\log_{b}x=\frac{\ln x}{\ln b}$. So, $\log_{3}x=\frac{\ln x}{\ln 3}\approx\frac{\ln x}{1.099}$.
Step3: Match the graphs
The graph with a steeper slope for larger $x$ values corresponds to $f(x)=3\ln x$, and the graph with a less steep slope for larger $x$ values corresponds to $g(x)=\log_{3}x$.
Answer:
| Function | Graph |
|---|---|
| $f(x)=3\ln x$ | The graph with a steeper slope for larger $x$ values among the given graphs |
| $g(x)=\log_{3}x$ | The graph with a less steep slope for larger $x$ values among the given graphs |