the number of hours of daylight on a given day in city a is given by the following function, where x is the…
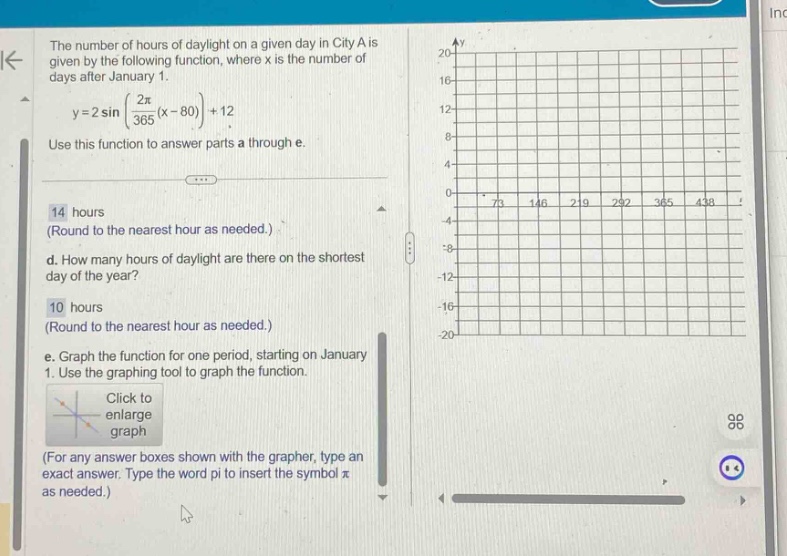
the number of hours of daylight on a given day in city a is given by the following function, where x is the number of days after january 1. y = 2 sin(2π/365(x - 80))+12. use this function to answer parts a through e. 14 hours (round to the nearest hour as needed.) d. how many hours of daylight are there on the shortest day of the year? 10 hours (round to the nearest hour as needed.) e. graph the function for one period, starting on january 1. use the graphing tool to graph the function. click to enlarge graph (for any answer boxes shown with the grapher, type an exact answer. type the word pi to insert the symbol π as needed.)
Answer
Explanation:
Step1: Analyze the sine - function properties
The general form of a sine function is $y = A\sin(B(x - C))+D$. In the given function $y = 2\sin\left(\frac{2\pi}{365}(x - 80)\right)+12$, where $A = 2$, $B=\frac{2\pi}{365}$, $C = 80$, and $D = 12$. The range of the sine function $\sin\left(\frac{2\pi}{365}(x - 80)\right)$ is $[- 1,1]$.
Step2: Find the minimum value of the function
To find the number of hours of daylight on the shortest day, we need to find the minimum value of $y$. Since the minimum value of $\sin\left(\frac{2\pi}{365}(x - 80)\right)$ is $-1$. Substitute $\sin\left(\frac{2\pi}{365}(x - 80)\right)=-1$ into the function $y = 2\sin\left(\frac{2\pi}{365}(x - 80)\right)+12$. We get $y=2\times(-1)+12$.
Step3: Calculate the result
$y=-2 + 12=10$.
For graphing the function $y = 2\sin\left(\frac{2\pi}{365}(x - 80)\right)+12$:
- The amplitude $|A| = 2$, which means the graph oscillates $2$ units above and below the mid - line $y = 12$.
- The period $T=\frac{2\pi}{B}$, and since $B=\frac{2\pi}{365}$, the period $T = 365$ days.
- The phase shift is $C = 80$ days.
We can create a table of values:
| $x$ (days after Jan 1) | $y = 2\sin\left(\frac{2\pi}{365}(x - 80)\right)+12$ |
|---|---|
| $80$ | $12$ |
| $80+\frac{365}{4}=171.25$ | $14$ |
| $80+\frac{365}{2}=262.5$ | $12$ |
| $80+\frac{3\times365}{4}=353.75$ | $10$ |
| $80 + 365=445$ | $12$ |
Then plot these points and connect them with a smooth curve to get the graph of the function for one period starting from $x = 0$ (January 1).
Answer:
d. 10 hours e. Graph the function using the key - points and properties described above.