part a: what do the x - intercepts and maximum value of the graph represent? what are the intervals where…
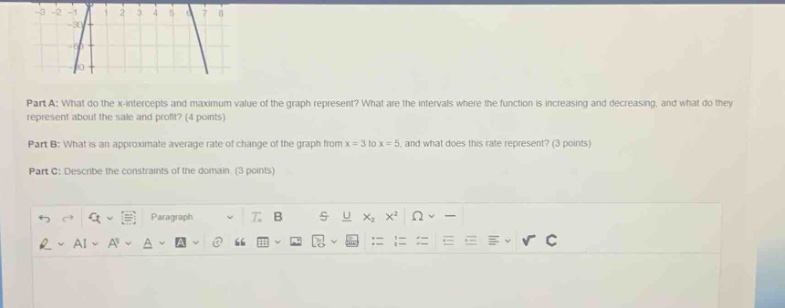
part a: what do the x - intercepts and maximum value of the graph represent? what are the intervals where the function is increasing and decreasing, and what do they represent about the sale and profit? (4 points)\npart b: what is an approximate average rate of change of the graph from x = 3 to x = 5, and what does this rate represent? (3 points)\npart c: describe the constraints of the domain. (3 points)
Answer
Explanation:
Step1: Analyze x - intercepts
The x - intercepts of the graph are the values of x for which the function value (y) is 0. In the context of sales and profit, they could represent the break - even points, where the profit is 0. Mathematically, if the function represents profit as a function of sales (say (y = f(x)) where (x) is sales and (y) is profit), when (y = 0), the company is neither making a profit nor a loss.
Step2: Analyze maximum value
The maximum value of the graph represents the highest profit that can be achieved. It occurs at the vertex of a parabolic - shaped profit function (if it is quadratic). The x - value at the maximum gives the amount of sales that will result in the maximum profit.
Step3: Analyze increasing and decreasing intervals
An increasing interval is where the function value (y) is getting larger as x increases. In terms of sales and profit, it means that as sales increase, profit is also increasing. A decreasing interval is where the function value (y) is getting smaller as x increases, so as sales increase, profit is decreasing.
Step4: Calculate average rate of change for Part B
The average rate of change of a function (y = f(x)) from (x=a) to (x = b) is given by (\frac{f(b)-f(a)}{b - a}). Let (a = 3) and (b = 5). We need to find the function values (f(3)) and (f(5)) from the graph and then calculate (\frac{f(5)-f(3)}{5 - 3}). This rate represents the average change in profit per unit change in sales over the interval from (x = 3) to (x = 5).
Step5: Analyze domain constraints for Part C
The domain of the function represents the possible values of the independent variable (in this case, sales). Constraints could be non - negative values of sales (since you can't have negative sales in a real - world context), upper bounds due to market capacity, production limits, or other real - world factors.
Answer:
Part A: The x - intercepts represent break - even points. The maximum value represents the highest profit. Increasing intervals mean profit increases with sales, and decreasing intervals mean profit decreases with sales. Part B: Calculate (\frac{f(5)-f(3)}{2}), which represents the average change in profit per unit change in sales from (x = 3) to (x = 5). Part C: Domain is likely non - negative due to real - world sales constraints, and may have an upper bound due to market or production limits.