the population p, in hundreds, of a small mining town in the california gold rush, is given by the function…
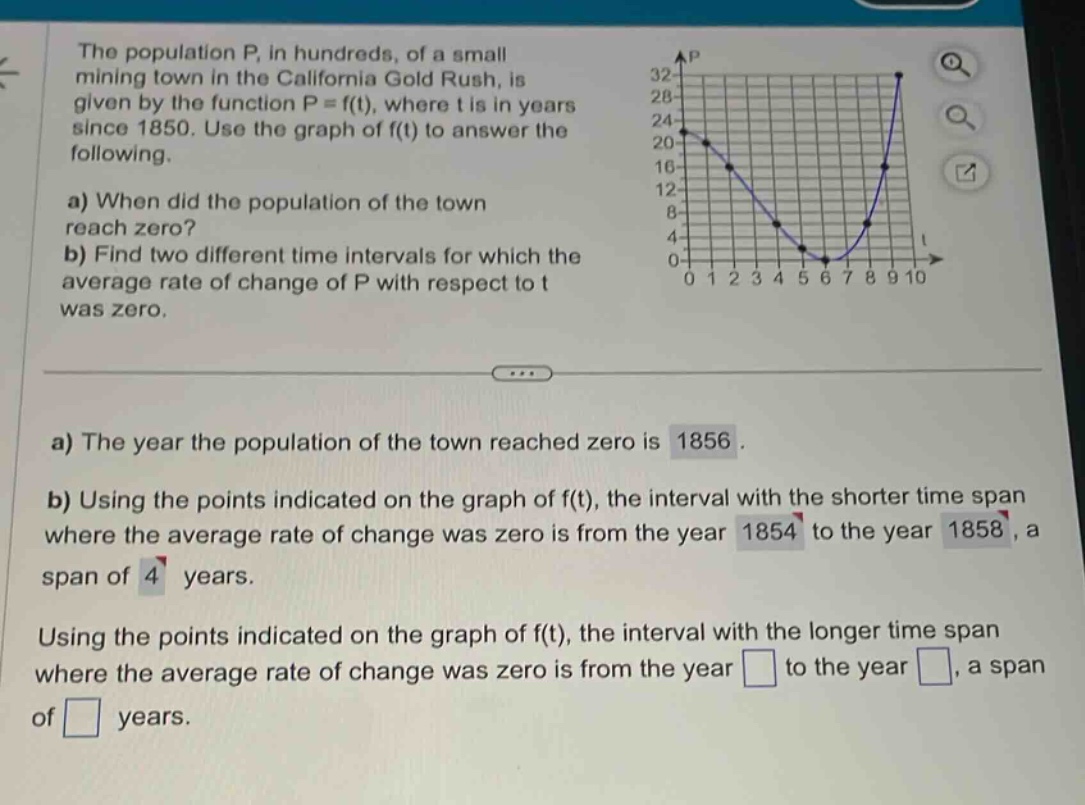
the population p, in hundreds, of a small mining town in the california gold rush, is given by the function p = f(t), where t is in years since 1850. use the graph of f(t) to answer the following.\na) when did the population of the town reach zero?\nb) find two different time intervals for which the average rate of change of p with respect to t was zero.\na) the year the population of the town reached zero is 1856.\nb) using the points indicated on the graph of f(t), the interval with the shorter time span where the average rate of change was zero is from the year 1854 to the year 1858, a span of 4 years.\nusing the points indicated on the graph of f(t), the interval with the longer time span where the average rate of change was zero is from the year to the year , a span of years.
Answer
Explanation:
Step1: Recall average - rate - of - change formula
The average rate of change of a function $y = f(x)$ over the interval $[x_1,x_2]$ is $\frac{f(x_2)-f(x_1)}{x_2 - x_1}$. For the function $P = f(t)$, we want $\frac{f(t_2)-f(t_1)}{t_2 - t_1}=0$, which means $f(t_1)=f(t_2)$.
Step2: Analyze the graph
Looking at the graph of $P = f(t)$, we can see that another pair of points with the same $P$ - value (population) is when $t_1 = 0$ and $t_2=10$. Since $t$ is in years since 1850, the years are 1850 and 1860. The time - span is $1860 - 1850=10$ years.
Answer:
The interval with the longer time span where the average rate of change was zero is from the year 1850 to the year 1860, a span of 10 years.