(b) the population of a large city remained constant for several years. then the population grows very…
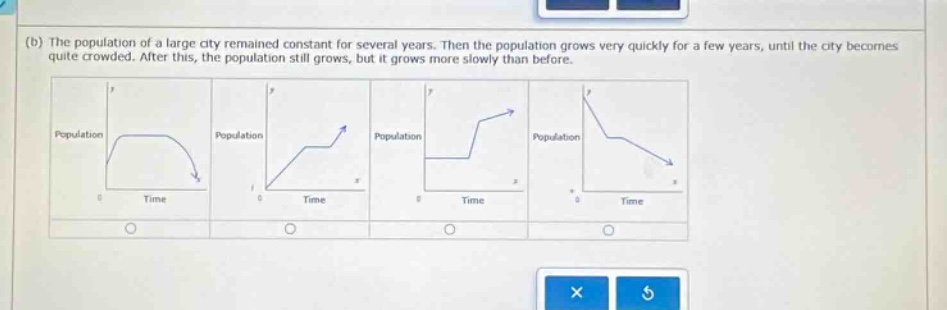
(b) the population of a large city remained constant for several years. then the population grows very quickly for a few years, until the city becomes quite crowded. after this, the population still grows, but it grows more slowly than before.
Answer
Explanation:
Step1: Analyze initial condition
The population is constant initially, so the graph should be a horizontal - line segment at first.
Step2: Analyze growth phase
Then it grows quickly, so the graph should have a steep positive - slope.
Step3: Analyze slower growth phase
After that, it still grows but more slowly, so the slope of the graph should decrease but remain positive.
The third graph (from the left) shows a horizontal line first (constant population), then a steep upward - sloping line (quick growth), and then a less steep upward - sloping line (slower growth).