the population of a town starts at 1,000 and doubles every decade. the graph below shows the towns…
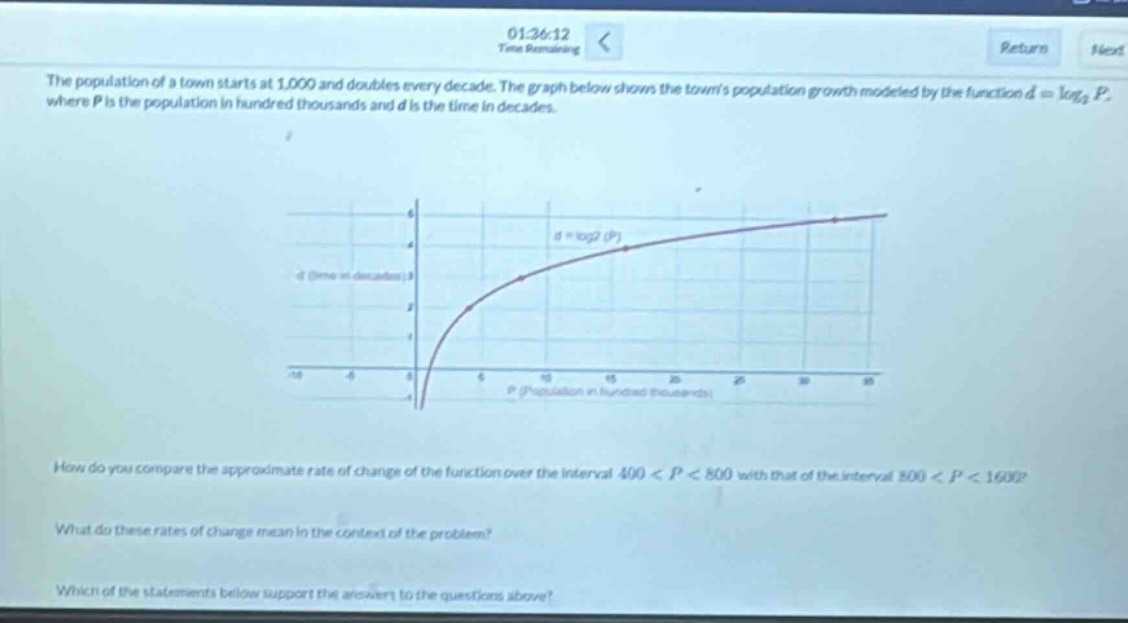
the population of a town starts at 1,000 and doubles every decade. the graph below shows the towns population growth modeled by the function d = log₂ p, where p is the population in hundred - thousands and d is the time in decades. how do you compare the approximate rate of change of the function over the interval 400 < p < 800 with that of the interval 800 < p < 1600? what do these rates of change mean in the context of the problem? which of the statements below support the answers to the questions above?
Answer
Answer:
- Comparison of rates of change: The approximate rate of change of the function (d = \log_2P) over the interval (400<P<800) is greater than the rate of change over the interval (800 < P<1600).
- Interpretation in context: In the context of the problem, the rate of change represents the number of decades it takes for the population (in hundred - thousands) to increase by a certain amount. A higher rate of change over (400 < P<800) means that it takes fewer decades for the population to increase from 400,000 to 800,000 compared to the time it takes to increase from 800,000 to 1,600,000.
- Supporting statements (not provided in the problem - but in general): Since the function (y=\log_2x) is a concave - down function (its second derivative is negative), the slope of the secant line (which represents the average rate of change) between two points on the curve decreases as the (x) - values (in this case (P)) increase.
Explanation:
Step1: Recall the formula for average rate of change
The average rate of change of a function (y = f(x)) over the interval ([a,b]) is (\frac{f(b)-f(a)}{b - a}). For the function (d=\log_2P), the average rate of change over ([a,b]) is (\frac{\log_2b-\log_2a}{b - a}).
Step2: Analyze the function (y = \log_2x)
The function (y=\log_2x) has the property that its derivative (y'=\frac{1}{x\ln 2}). As (x) (or (P) in our case) increases, the value of the derivative decreases. This means the function is concave - down.
Step3: Calculate rate of change for intervals
For the interval (400 < P<800), let (a = 400) and (b = 800). The rate of change (r_1=\frac{\log_2800-\log_2400}{800 - 400}=\frac{\log_2\frac{800}{400}}{400}=\frac{\log_22}{400}=\frac{1}{400}). For the interval (800 < P<1600), let (a = 800) and (b = 1600). The rate of change (r_2=\frac{\log_21600-\log_2800}{1600 - 800}=\frac{\log_2\frac{1600}{800}}{800}=\frac{\log_22}{800}=\frac{1}{800}). Since (\frac{1}{400}>\frac{1}{800}), the rate of change over (400 < P<800) is greater.
Step4: Interpret in context
The rate of change (\frac{\Delta d}{\Delta P}) tells us how many decades ((\Delta d)) it takes for the population ((\Delta P)) to increase. A larger rate of change means a smaller increase in decades for a given increase in population in the first interval compared to the second interval.