position the four points so they do not coincide and so they all lie on the graph of the same logarithmic…
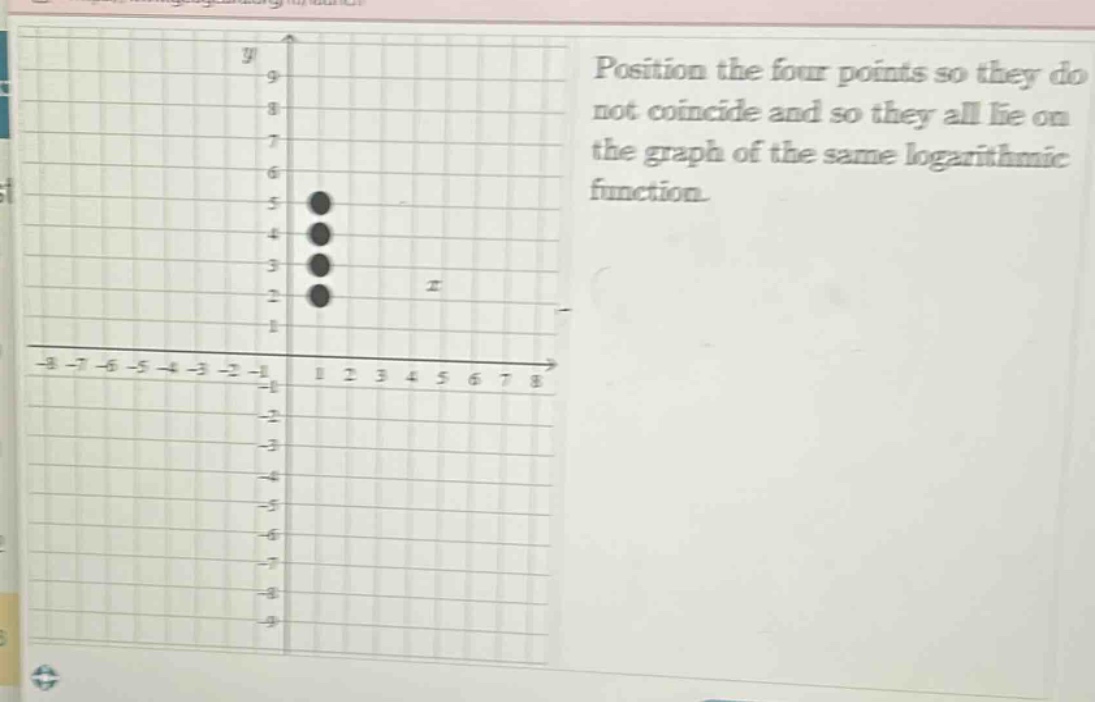
position the four points so they do not coincide and so they all lie on the graph of the same logarithmic function.
Answer
Explanation:
Step1: Recall the form of a logarithmic function
The general form of a logarithmic function is $y = a\log_b(x - h)+k$. For simplicity, consider the basic logarithmic - function $y=\log(x)$ (where $a = 1$, $b = 10$, $h = 0$, $k = 0$). The domain of $y=\log(x)$ is $x>0$.
Step2: Select points on the graph
We know that if $y = \log(x)$, when $x = 1$, $y=\log(1)=0$; when $x = 10$, $y=\log(10) = 1$; when $x = 100$, $y=\log(100)=2$; when $x = 1000$, $y=\log(1000)=3$. So we can choose the points $(1,0)$, $(10,1)$, $(100,2)$, $(1000,3)$. On the given grid, we can position the points such that for $x = 1,y = 0$; for $x = 10,y = 1$; for $x = 100,y = 2$; for $x = 1000,y = 3$. We can scale the $x$ - values and adjust according to the grid size. For example, if we consider $y=\log_{10}(x)$ and choose $x = 1,y = 0$; $x = 2,y=\log_{10}(2)\approx0.301$; $x = 4,y=\log_{10}(4)\approx0.602$; $x = 8,y=\log_{10}(8)\approx0.903$.
Answer:
Points such as $(1,0)$, $(2,\log_{10}(2))$, $(4,\log_{10}(4))$, $(8,\log_{10}(8))$ can be plotted on the grid. (The $y$ - values $\log_{10}(2)\approx0.301$, $\log_{10}(4)\approx0.602$, $\log_{10}(8)\approx0.903$ can be approximated on the grid.)