2. (5 pts) the graph shown to the right is a rate of change graph. the questions below are based on the…
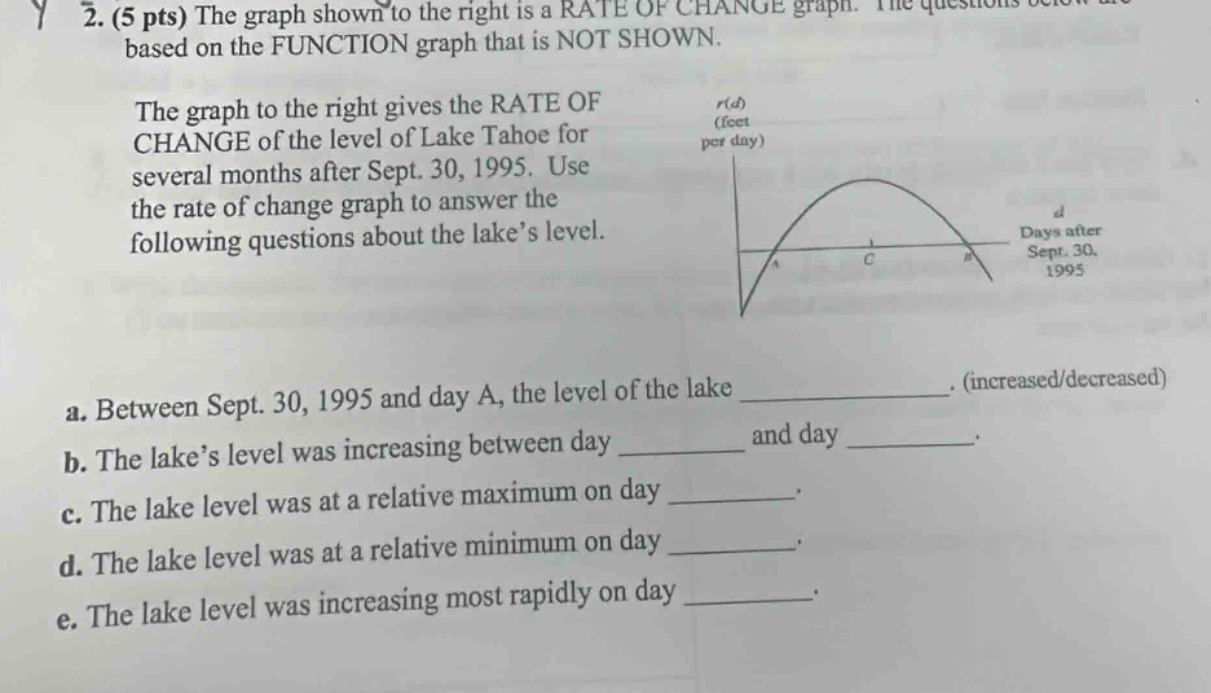
2. (5 pts) the graph shown to the right is a rate of change graph. the questions below are based on the function graph that is not shown. the graph to the right gives the rate of change of the level of lake tahoe for several months after sept. 30, 1995. use the rate of change graph to answer the following questions about the lake’s level. a. between sept. 30, 1995 and day a, the level of the lake _______________. (increased/decreased) b. the lake’s level was increasing between day ____________ and day ____________. c. the lake level was at a relative maximum on day ____________. d. the lake level was at a relative minimum on day ____________. e. the lake level was increasing most rapidly on day ____________.
Answer
Explanation:
Step1: Analyze sign of rate - of - change
If the rate - of - change $r(d)>0$, the level of the lake is increasing; if $r(d)<0$, the level of the lake is decreasing. Between Sept. 30, 1995 and day A, $r(d)<0$. So the level of the lake decreased.
Step2: Find when $r(d)>0$
The lake's level is increasing when $r(d)>0$. From the graph, $r(d)>0$ between day A and day B.
Step3: Locate relative maximum
The lake level is at a relative maximum when the rate of change changes from positive to negative. This occurs at day B.
Step4: Locate relative minimum
The lake level is at a relative minimum when the rate of change changes from negative to positive. This occurs at day A.
Step5: Find maximum of $r(d)$
The lake level is increasing most rapidly when $r(d)$ reaches its maximum value. From the graph, this occurs at day C.
Answer:
a. decreased b. A, B c. B d. A e. C