question 1 of 10 according to the graph of h(w) below, what happens when w gets close to zero? a. h(w) gets…
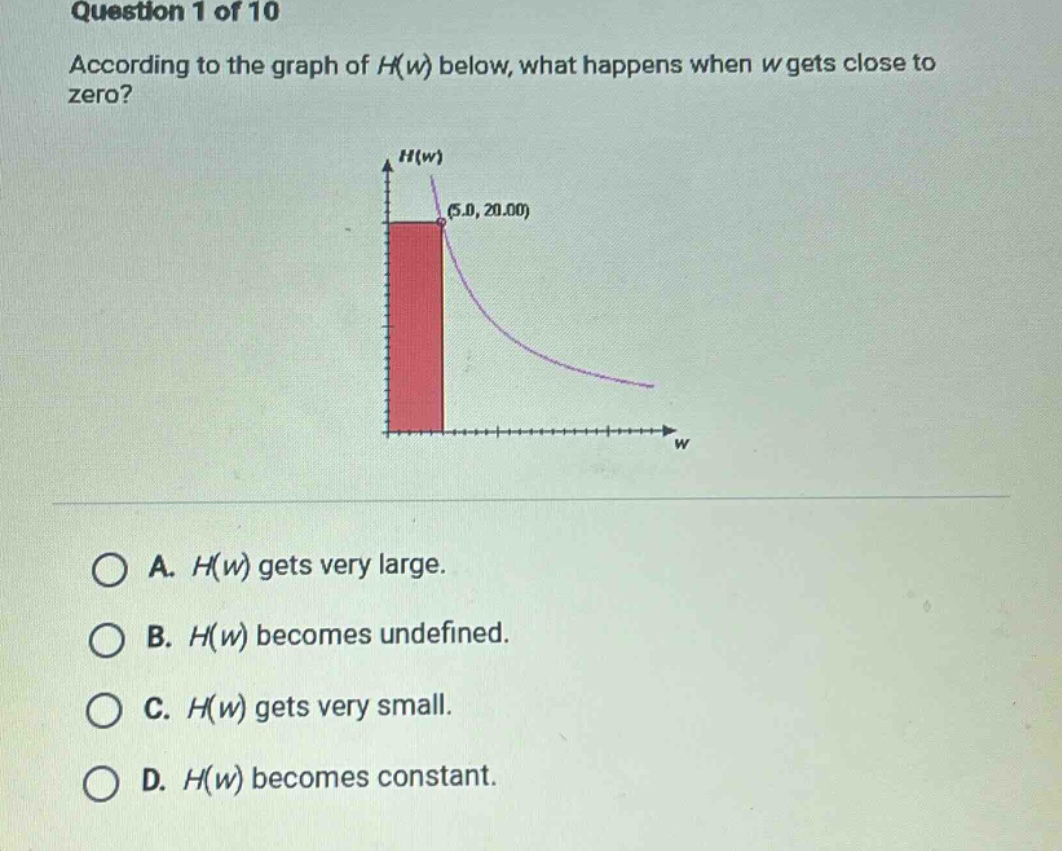
question 1 of 10 according to the graph of h(w) below, what happens when w gets close to zero? a. h(w) gets very large. b. h(w) becomes undefined. c. h(w) gets very small. d. h(w) becomes constant.
Answer
Answer:
A. $H(w)$ gets very large.
Explanation:
Step1: Observe the graph trend
As $w$ approaches 0 from the right - hand side, the value of $H(w)$ increases along the curve.
Step2: Analyze the limit behavior
The curve of $H(w)$ shoots up as $w$ gets close to 0, indicating that $H(w)$ becomes very large.