question 2 of 17 the rectangles in the figure have been drawn to approximate ∫₀⁶ g(x)dx. (a) do the…
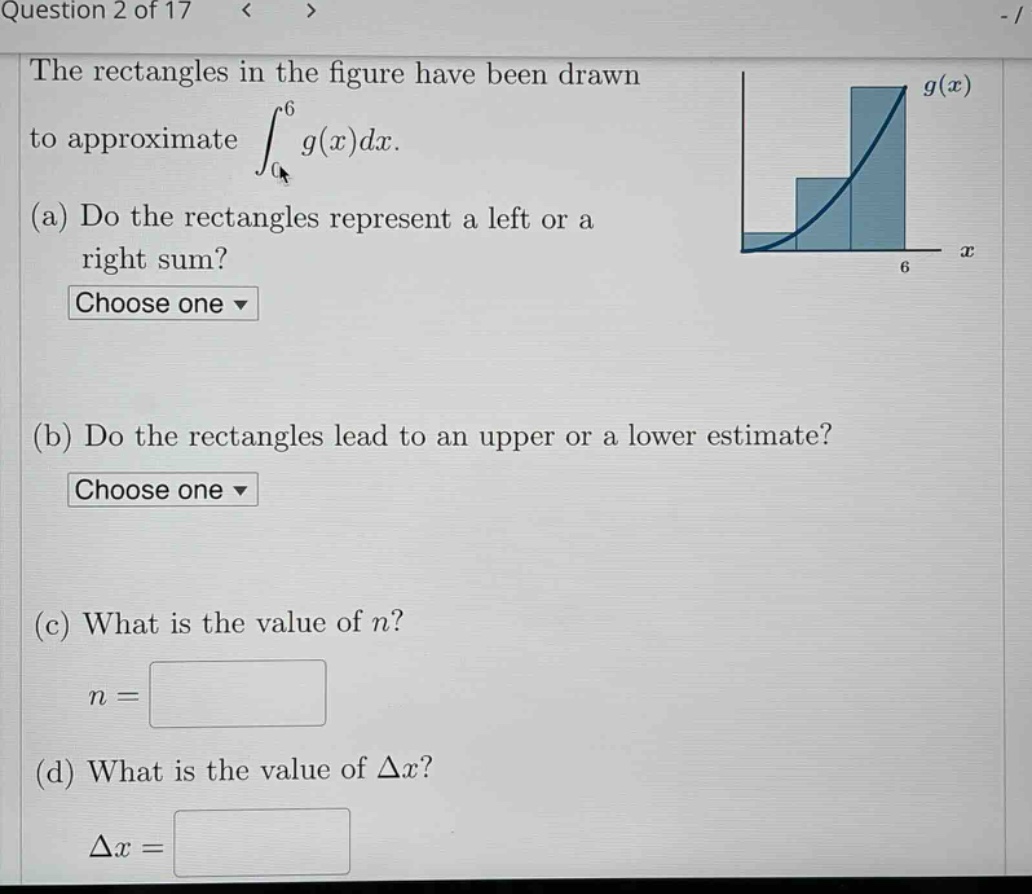
question 2 of 17 the rectangles in the figure have been drawn to approximate ∫₀⁶ g(x)dx. (a) do the rectangles represent a left or a right sum? choose one (b) do the rectangles lead to an upper or a lower estimate? choose one (c) what is the value of n? n = (d) what is the value of δx? δx =
Answer
Explanation:
Step1: Identify left - right sum
The height of each rectangle is determined by the function value at the left - hand endpoint of the sub - interval. So, it is a left sum.
Step2: Determine upper - lower estimate
The function $g(x)$ is increasing on the interval $[0,6]$. For an increasing function, a left - hand sum gives a lower estimate.
Step3: Find the number of sub - intervals $n$
Count the number of rectangles. There are 3 rectangles, so $n = 3$.
Step4: Calculate $\Delta x$
The formula for $\Delta x=\frac{b - a}{n}$, where $a = 0$, $b = 6$ and $n = 3$. So, $\Delta x=\frac{6-0}{3}=2$.
Answer:
(a) Left sum (b) Lower estimate (c) $n = 3$ (d) $\Delta x = 2$