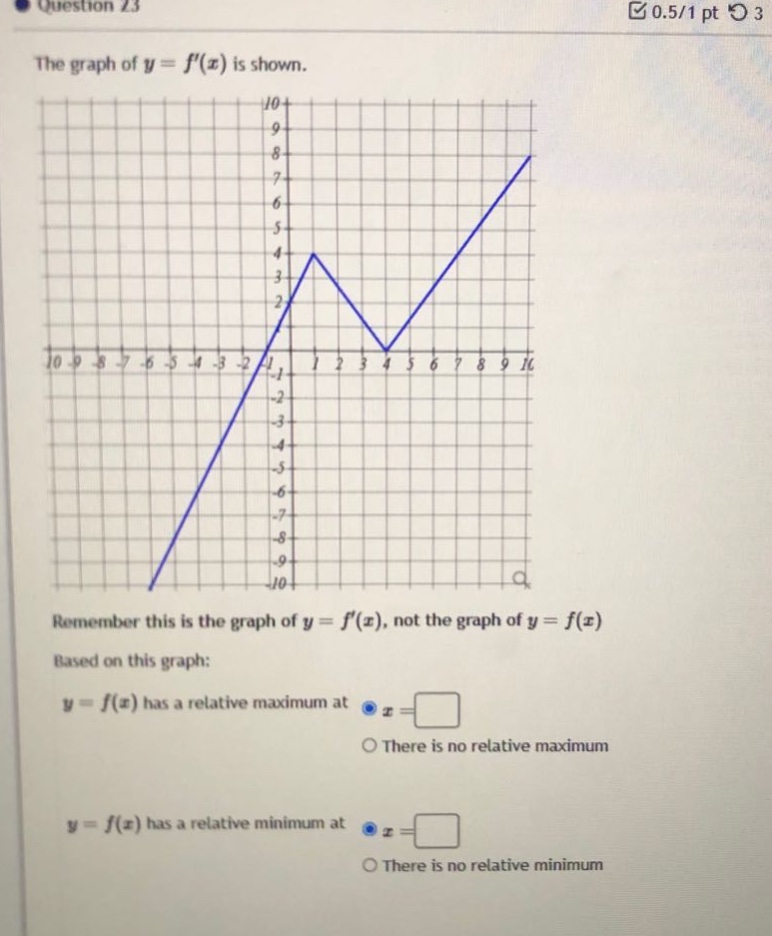
question 23\nthe graph of y = f(x) is shown.\nremember this is the graph of y = f(x), not the graph of y =…
question 23\nthe graph of y = f(x) is shown.\nremember this is the graph of y = f(x), not the graph of y = f(x)\nbased on this graph:\ny = f(x) has a relative maximum at x=\nthere is no relative maximum\ny = f(x) has a relative minimum at x=\nthere is no relative minimum
Answer
Explanation:
Step1: Recall the first - derivative test
The first - derivative test states that if (f^{\prime}(x)) changes sign from positive to negative at a point (c), then (f(x)) has a relative maximum at (x = c). If (f^{\prime}(x)) changes sign from negative to positive at a point (c), then (f(x)) has a relative minimum at (x = c).
Step2: Analyze the sign - change of (f^{\prime}(x)) for relative maximum
Looking at the graph of (y = f^{\prime}(x)), we see that (f^{\prime}(x)) changes sign from positive to negative at (x=-1). Before (x = - 1), (f^{\prime}(x)>0) (the graph of (y = f^{\prime}(x)) is above the (x) - axis) and after (x=-1), (f^{\prime}(x)<0) (the graph of (y = f^{\prime}(x)) is below the (x) - axis). So (y = f(x)) has a relative maximum at (x=-1).
Step3: Analyze the sign - change of (f^{\prime}(x)) for relative minimum
We observe that (f^{\prime}(x)) changes sign from negative to positive at (x = 4). Before (x = 4), (f^{\prime}(x)<0) (the graph of (y = f^{\prime}(x)) is below the (x) - axis) and after (x = 4), (f^{\prime}(x)>0) (the graph of (y = f^{\prime}(x)) is above the (x) - axis). So (y = f(x)) has a relative minimum at (x = 4).
Answer:
(y = f(x)) has a relative maximum at (x=-1) (y = f(x)) has a relative minimum at (x = 4)