question:\nconsider the function $y = 2 \\sin(x)$ for $0^{\\circ} \\le x \\le 360^{\\circ}$.\n\n1. graph the…
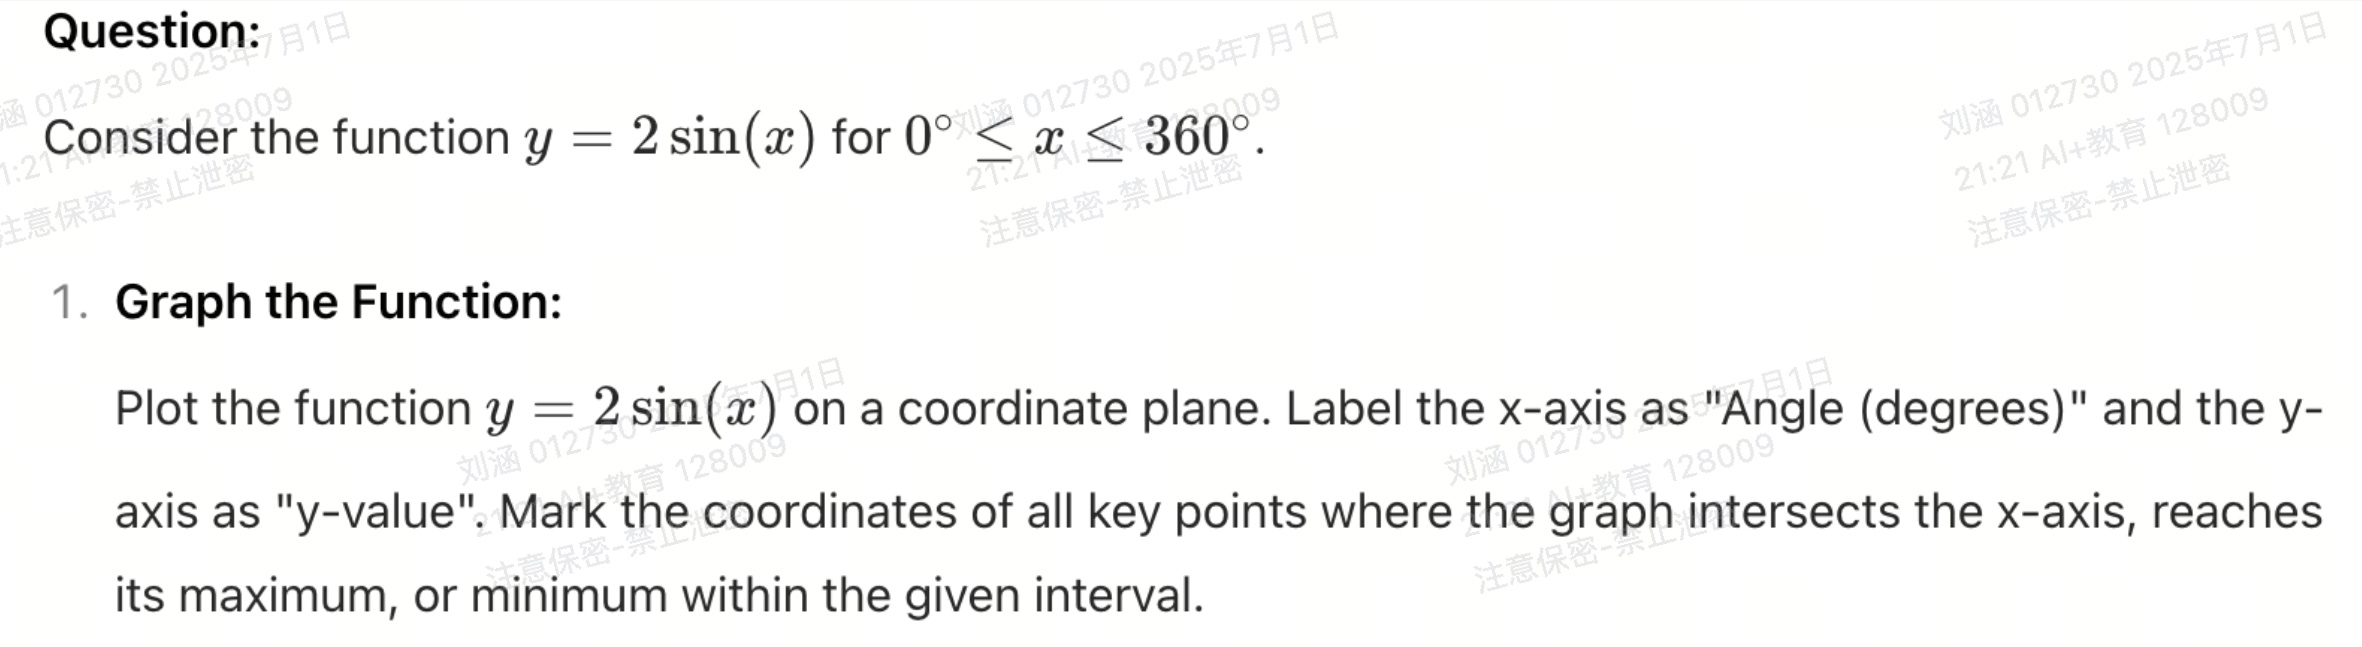
question:\nconsider the function $y = 2 \\sin(x)$ for $0^{\\circ} \\le x \\le 360^{\\circ}$.\n\n1. graph the function:\nplot the function $y = 2 \\sin(x)$ on a coordinate plane. label the x-axis as \angle (degrees)\ and the y-axis as \y-value\. mark the coordinates of all key points where the graph intersects the x-axis, reaches its maximum, or minimum within the given interval.
Answer
Explanation:
Step1: Identify the amplitude and period
The function $y = 2 \sin(x)$ has an amplitude of $|2| = 2$ and a period of $360^{\circ}$.
Step2: Determine x-intercepts in the interval
The sine function is zero at $0^{\circ}$, $180^{\circ}$, and $360^{\circ}$. $$ (0^{\circ}, 0), (180^{\circ}, 0), (360^{\circ}, 0) $$
Step3: Determine the maximum point
The maximum value occurs when $\sin(x) = 1$, which is at $x = 90^{\circ}$. $$ y = 2(1) = 2 \implies (90^{\circ}, 2) $$
Step4: Determine the minimum point
The minimum value occurs when $\sin(x) = -1$, which is at $x = 270^{\circ}$. $$ y = 2(-1) = -2 \implies (270^{\circ}, -2) $$
Step5: Sketch the sine wave
Plot the five key points and connect them with a smooth curve.
Answer:
The graph is a sine wave starting at $(0^{\circ}, 0)$, rising to a maximum at $(90^{\circ}, 2)$, crossing the x-axis at $(180^{\circ}, 0)$, falling to a minimum at $(270^{\circ}, -2)$, and returning to the x-axis at $(360^{\circ}, 0)$. The x-axis is labeled "Angle (degrees)" and the y-axis is labeled "y-value".