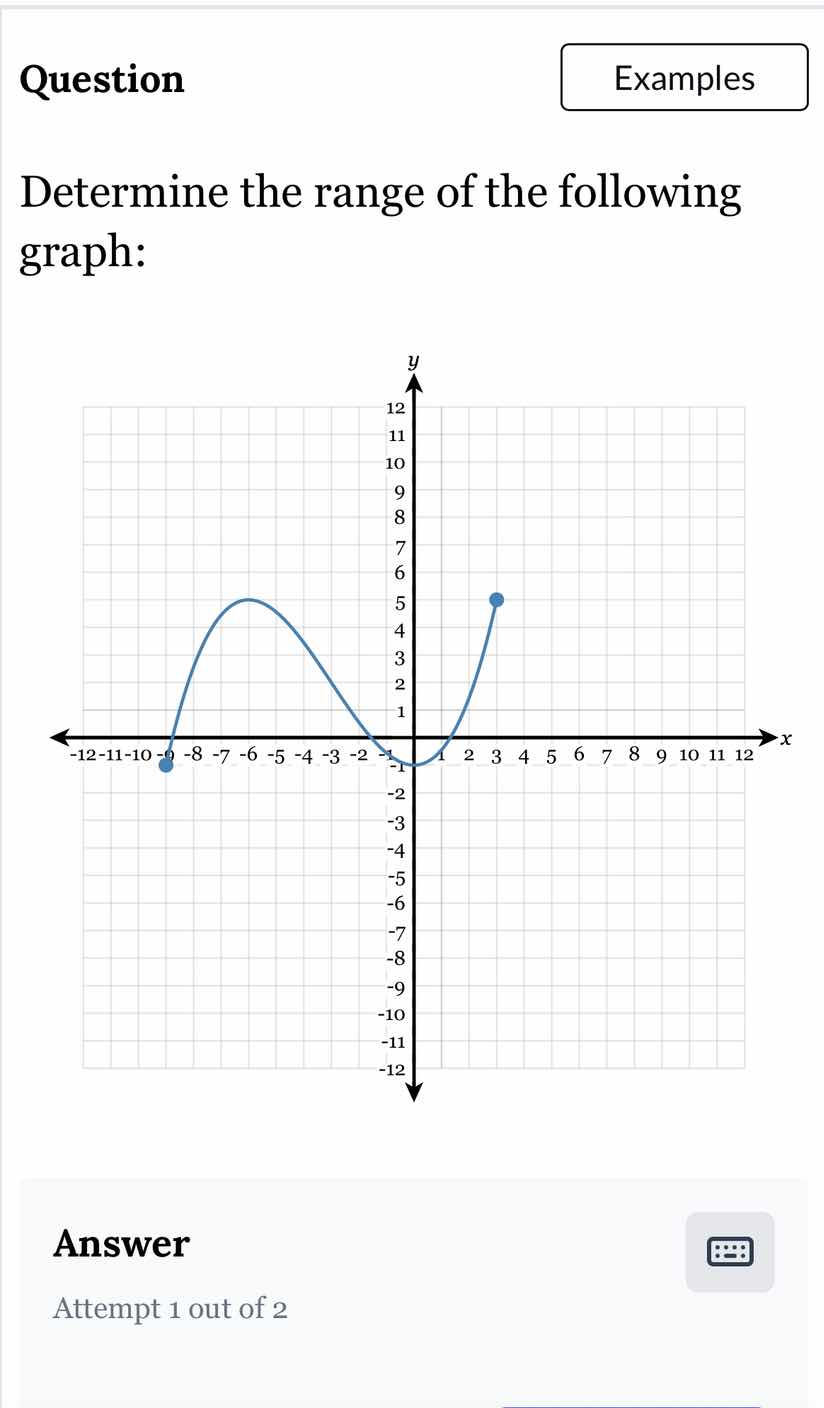
question\nexamples\ndetermine the range of the following graph:\nanswer\nattempt 1 out of 2
question\nexamples\ndetermine the range of the following graph:\nanswer\nattempt 1 out of 2
Answer
Explanation:
Step1: Identify lowest y-value
The minimum y-value on the graph is $-1$, at $x=0$.
Step2: Identify highest y-value
The maximum y-value shown (and the peak of the curve) is $6$, with all points on the graph having y-values between $-1$ and $6$, inclusive (closed dots indicate endpoints are included).
Step3: Define the range
The range is all y-values the function takes, from the minimum to maximum.
Answer:
$-1 \leq y \leq 6$ (or in interval notation: $[-1, 6]$)