question the graph of the function f(x) = 2x/5 + 2 is shown below as a blue curve. create a visualization of…
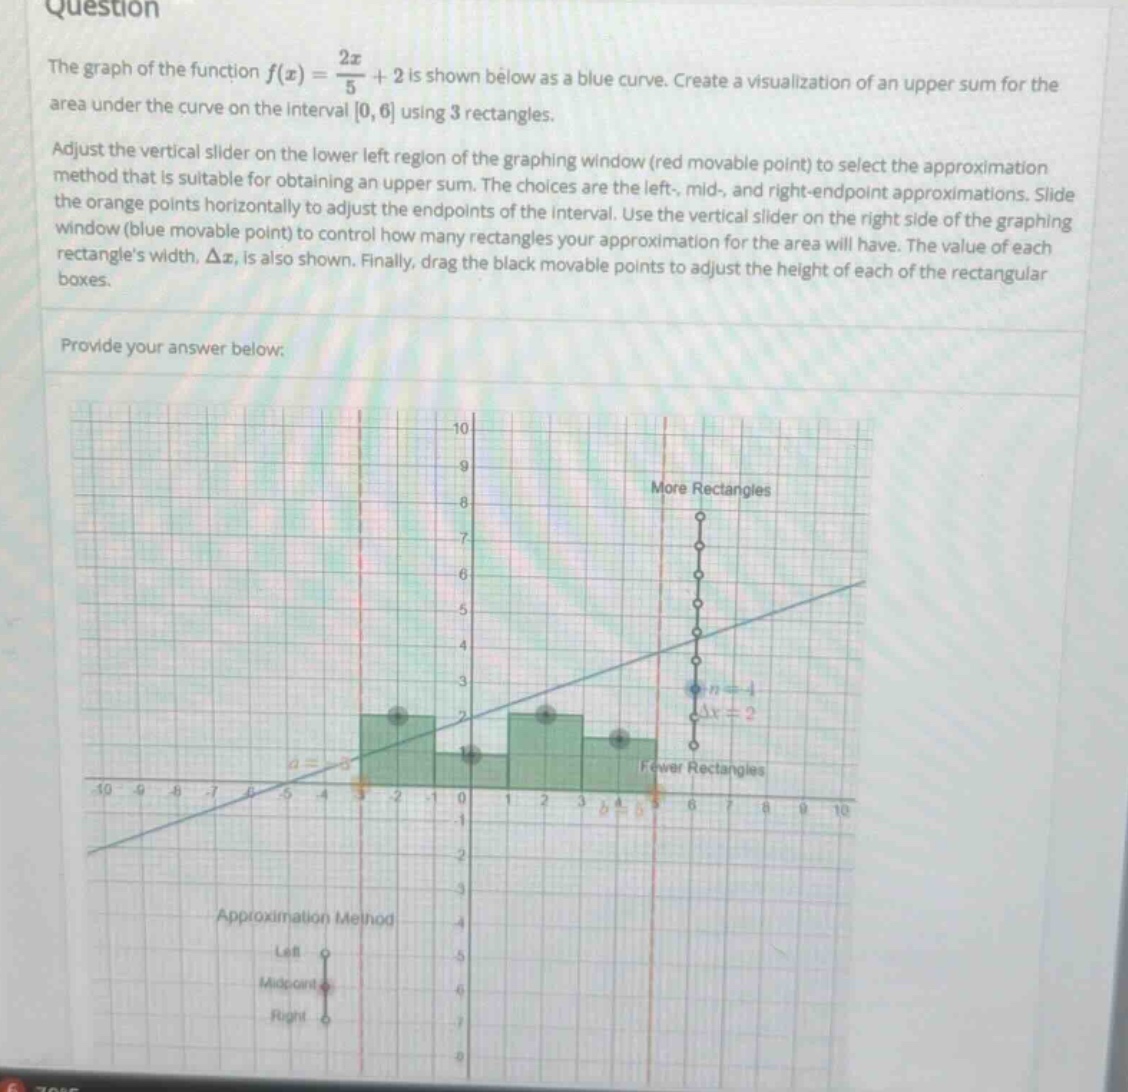
question the graph of the function f(x) = 2x/5 + 2 is shown below as a blue curve. create a visualization of an upper sum for the area under the curve on the interval 0,6 using 3 rectangles. adjust the vertical slider on the lower left region of the graphing window (red movable point) to select the approximation method that is suitable for obtaining an upper sum. the choices are the left-, mid-, and right - endpoint approximations. slide the orange points horizontally to adjust the endpoints of the interval. use the vertical slider on the right side of the graphing window (blue movable point) to control how many rectangles your approximation for the area will have. the value of each rectangles width, δx, is also shown. finally, drag the black movable points to adjust the height of each of the rectangular boxes. provide your answer below:
Answer
Explanation:
Step1: Determine the width of each rectangle
The interval is $[0,6]$ and we want $n = 3$ rectangles. The width of each rectangle $\Delta x=\frac{b - a}{n}$, where $a = 0$ and $b=6$. So $\Delta x=\frac{6 - 0}{3}=2$.
Step2: Find the right - hand endpoints
The right - hand endpoints of the sub - intervals $[x_{i-1},x_{i}]$ for $i = 1,2,3$ are $x_1=2$, $x_2 = 4$, $x_3=6$.
Step3: Evaluate the function at the right - hand endpoints
For $x = 2$, $f(2)=\frac{2\times2}{5}+2=\frac{4}{5}+2=\frac{4 + 10}{5}=\frac{14}{5}=2.8$. For $x = 4$, $f(4)=\frac{2\times4}{5}+2=\frac{8}{5}+2=\frac{8 + 10}{5}=\frac{18}{5}=3.6$. For $x = 6$, $f(6)=\frac{2\times6}{5}+2=\frac{12}{5}+2=\frac{12+10}{5}=\frac{22}{5}=4.4$.
Step4: Calculate the upper sum
The upper sum $U=\sum_{i = 1}^{3}f(x_i)\Delta x$. $U=f(2)\Delta x+f(4)\Delta x+f(6)\Delta x$. $U = 2.8\times2+3.6\times2+4.4\times2$. $U=(2.8 + 3.6+4.4)\times2$. $U=(10.8)\times2=21.6$.
Answer:
$21.6$