question\n\nthe graph of $f(x)$ is shown below. find the graph of $f(x)$.\n\nselect the correct answer below:
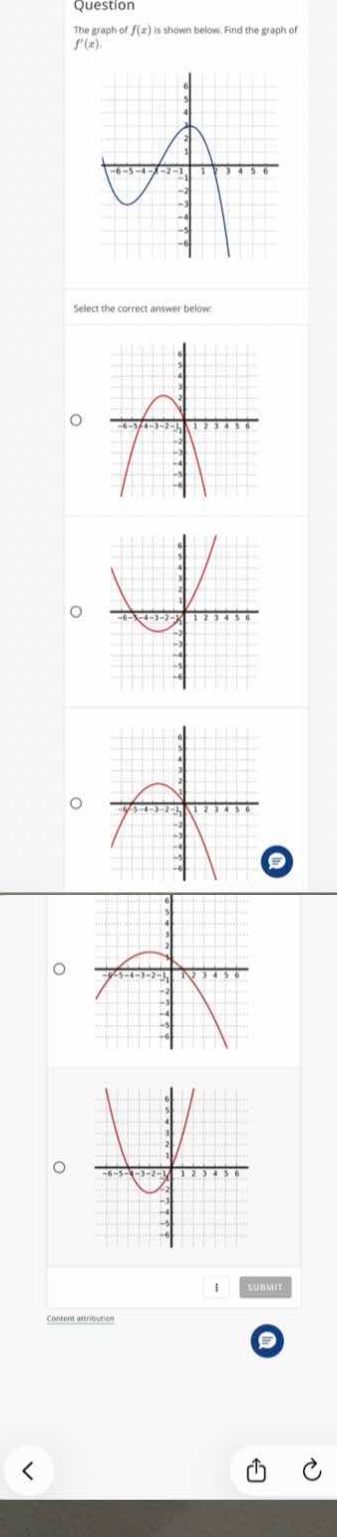
question\n\nthe graph of $f(x)$ is shown below. find the graph of $f(x)$.\n\nselect the correct answer below:
Answer
Explanation:
Step1: Identify critical points of $f(x)$
The graph of $f(x)$ has local extrema at $x \approx -5$ (minimum) and $x \approx -1$ (maximum).
Step2: Determine zeros of $f'(x)$
At local extrema, the derivative is zero. Thus, $f'(x)$ must have x-intercepts at $x \approx -5$ and $x \approx -1$.
Step3: Analyze intervals of increase/decrease
$f(x)$ increases on $(-5, -1)$, so $f'(x) > 0$ there. $f(x)$ decreases on $(-\infty, -5)$ and $(-1, \infty)$, so $f'(x) < 0$ there.
Step4: Match with provided options
The first option shows a downward-opening parabola with x-intercepts at $x = -5$ and $x = -1$, and a positive peak between them.
Answer:
The first option (downward-opening parabola with x-intercepts at -5 and -1).