question 2(multiple choice worth 1 points) (08.01 mc) the graph below shows the value of ednas profits f(t)…
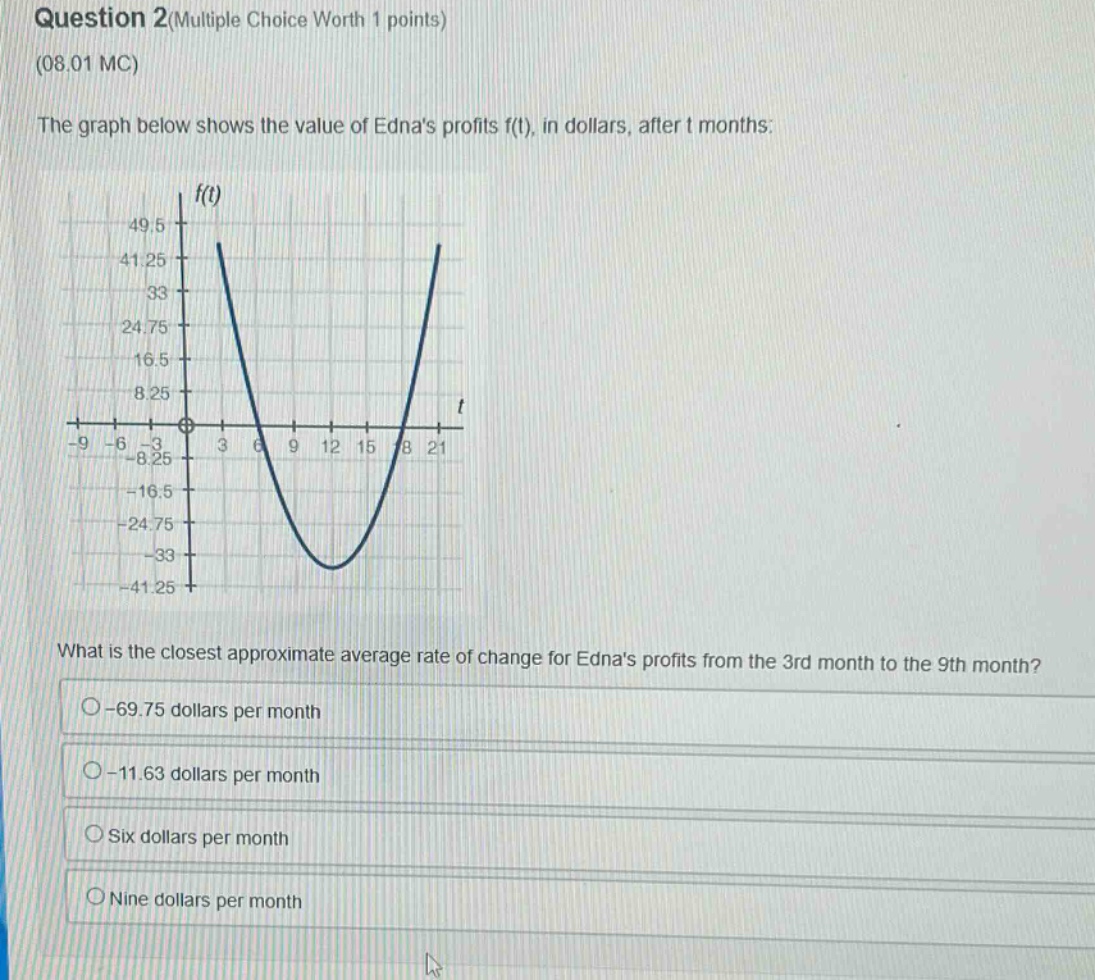
question 2(multiple choice worth 1 points) (08.01 mc) the graph below shows the value of ednas profits f(t), in dollars, after t months: what is the closest approximate average rate of change for ednas profits from the 3rd month to the 9th month? -69.75 dollars per month -11.63 dollars per month six dollars per month nine dollars per month
Answer
Explanation:
Step1: Recall average - rate - of - change formula
The average rate of change of a function $y = f(t)$ from $t = a$ to $t = b$ is $\frac{f(b)-f(a)}{b - a}$. Here, $a = 3$, $b = 9$.
Step2: Estimate $f(3)$ and $f(9)$ from the graph
From the graph, when $t = 3$, $f(3)\approx41.25$; when $t = 9$, $f(9)\approx - 24.75$.
Step3: Calculate the average rate of change
$\frac{f(9)-f(3)}{9 - 3}=\frac{-24.75 - 41.25}{6}=\frac{-66}{6}=-11$ dollars per month. The closest value to $- 11$ among the options is $-11.63$ dollars per month.
Answer:
-11.63 dollars per month