question\na third - degree polynomial function has three real zeros, has a relative minimum at (2,-3), and…
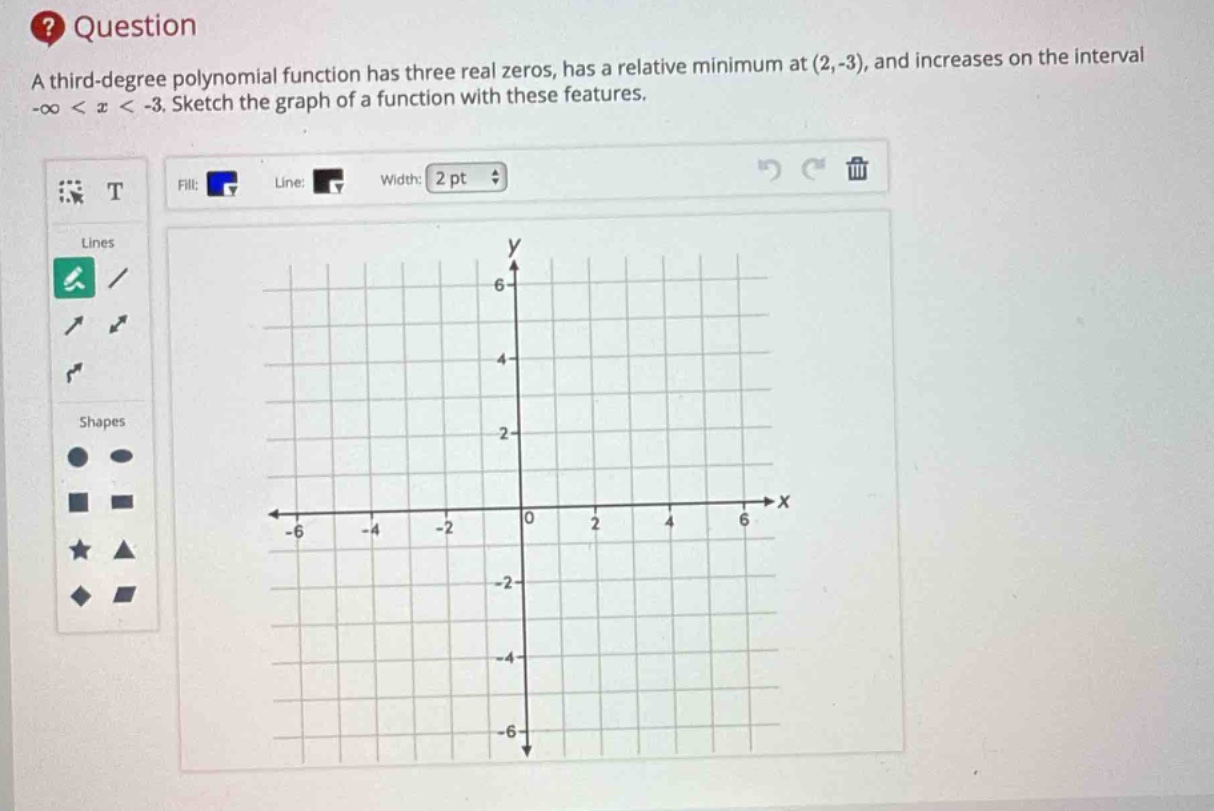
question\na third - degree polynomial function has three real zeros, has a relative minimum at (2,-3), and increases on the interval -∞ < x < -3. sketch the graph of a function with these features.
Answer
Answer:
- Start with the general shape of a third - degree polynomial:
- A third - degree polynomial (y = ax^{3}+bx^{2}+cx + d) with (a\neq0) has an end - behavior. Since the function increases on the interval ((-\infty,-3)), the leading coefficient (a>0) (because for (y = ax^{3}+bx^{2}+cx + d), when (a>0), as (x\to-\infty), (y\to-\infty) and as (x\to+\infty), (y\to+\infty)).
- Plot the relative minimum point:
- Plot the point ((2, - 3)) on the coordinate plane.
- Use the information about the zeros:
- Since it is a third - degree polynomial with three real zeros, and we know the behavior of the function. The function is increasing on ((-\infty,-3)), then it must cross the (x) - axis at some point in the interval ((-\infty,-3)). Let's call this zero (x_1<-3).
- Because there is a relative minimum at ((2,-3)), the function must turn around at this point and then cross the (x) - axis again for the third zero. Let the other two zeros be (x_2) and (x_3) such that (x_2<2<x_3).
- Sketch the curve:
- Start from the lower left (since (a > 0) and (x\to-\infty,y\to-\infty)), the curve increases until it crosses the (x) - axis at (x_1). Then it continues to increase until it reaches the relative minimum at ((2,-3)). After the relative minimum, it turns around and increases again, crossing the (x) - axis at (x_3) and going to the upper right (since (x\to+\infty,y\to+\infty)).
(Note: This is a qualitative sketch. Without more information about the zeros, we cannot be more precise about the exact (x) - intercepts. But the general shape and key features are as described above.)
Explanation:
Step1: Determine leading - coefficient sign
Since the function increases on ((-\infty,-3)), (a>0) for (y = ax^{3}+bx^{2}+cx + d).
Step2: Plot the relative minimum
Mark the point ((2,-3)) on the graph.
Step3: Consider the zeros
A third - degree polynomial with three real zeros will cross the (x) - axis three times. Use the relative minimum and the increasing interval to estimate the positions of the zeros.
Step4: Sketch the curve
Draw a smooth curve with the correct end - behavior, passing through the relative minimum and the estimated zero positions.