? question use the graph to determine the behavior of the function between the indicated points. points…
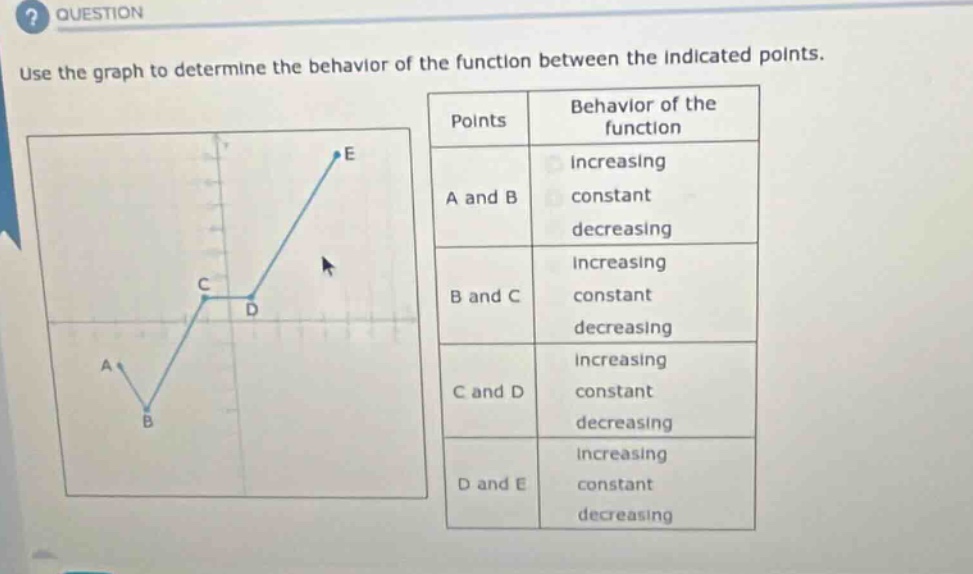
? question use the graph to determine the behavior of the function between the indicated points. points behavior of the function e increasing a and b constant decreasing increasing b and c constant decreasing increasing c and d constant decreasing increasing d and e constant decreasing a b
Answer
Explanation:
Step1: Analyze A - B
As we move from A to B on the x - axis, the y - values of the function are getting smaller. So the function is decreasing.
Step2: Analyze B - C
As we move from B to C on the x - axis, the y - values of the function are getting larger. So the function is increasing.
Step3: Analyze C - D
As we move from C to D on the x - axis, the y - values of the function remain the same. So the function is constant.
Step4: Analyze D - E
As we move from D to E on the x - axis, the y - values of the function are getting larger. So the function is increasing.
Answer:
A and B: decreasing B and C: increasing C and D: constant D and E: increasing