question write the equation of the trigonometric function shown in the graph.
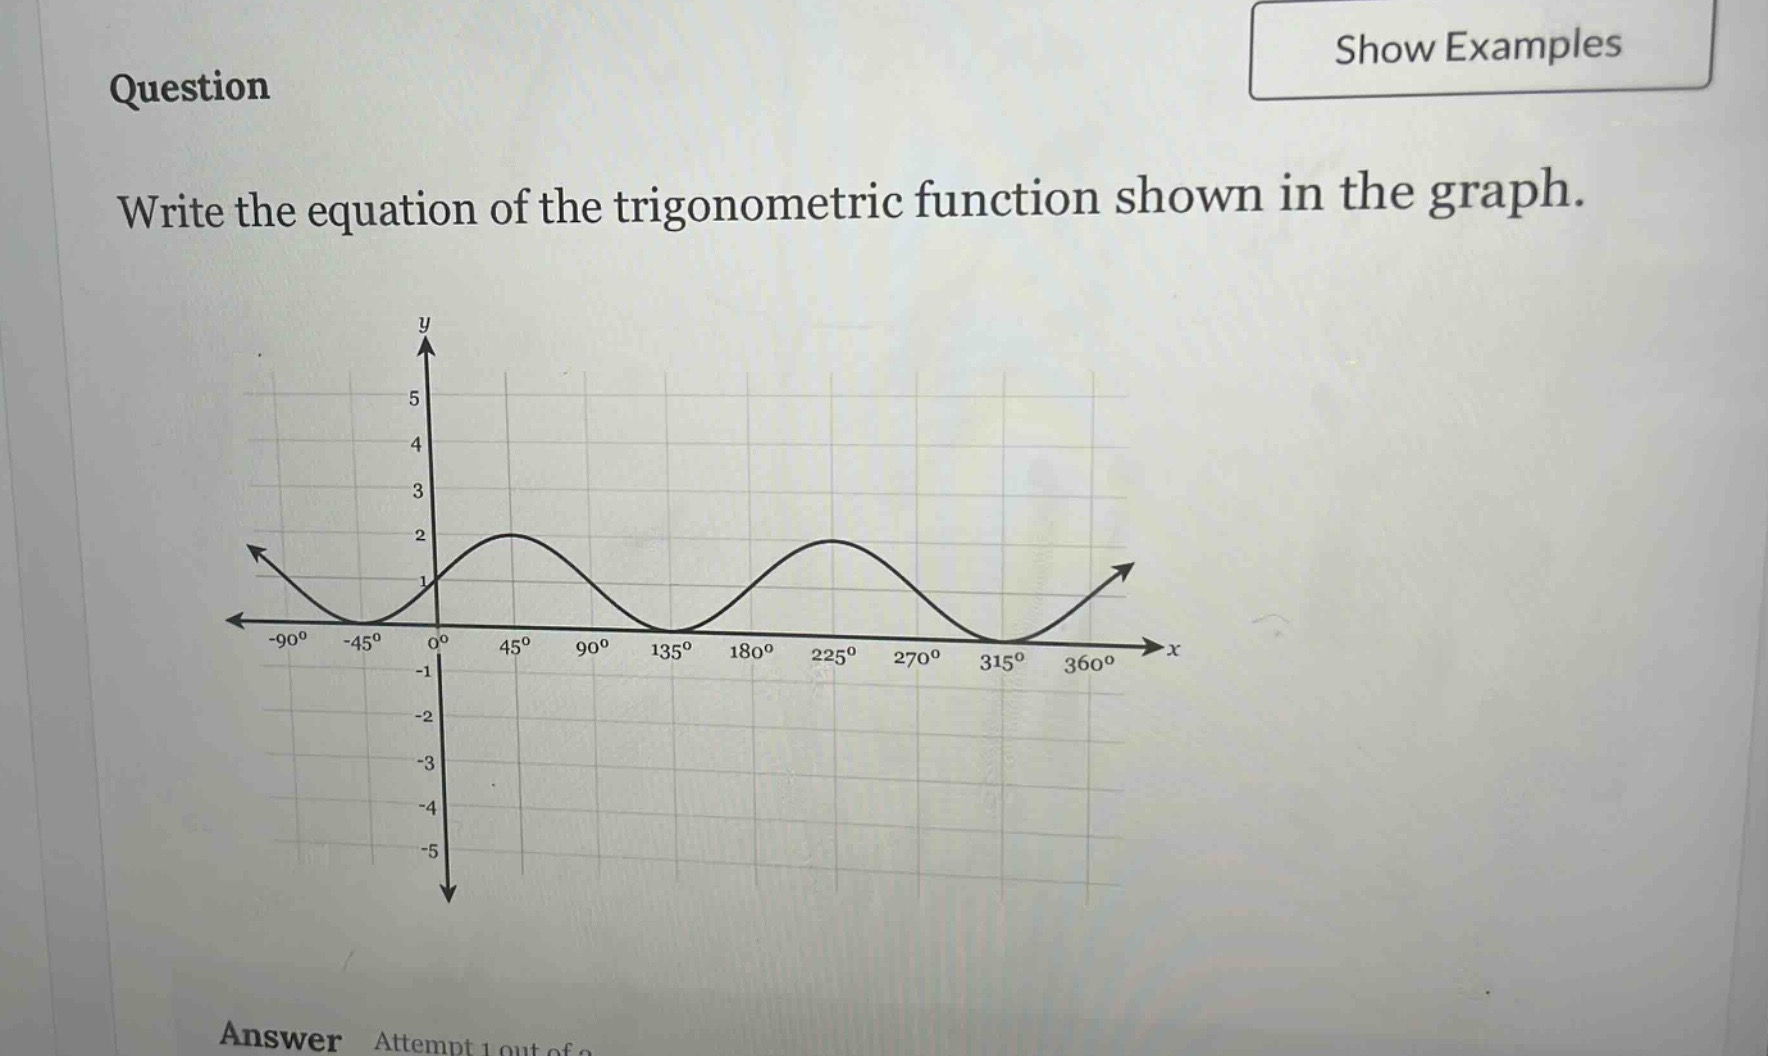
question write the equation of the trigonometric function shown in the graph.
Answer
Explanation:
Step1: Determine the general form
The general form of a sinusoidal function is $y = A\sin(Bx - C)+D$ or $y = A\cos(Bx - C)+D$. The graph passes through the origin, so we can use the sine - form $y = A\sin(Bx - C)+D$.
Step2: Find the amplitude $A$
The amplitude $A$ is half of the vertical distance between the maximum and minimum values. The maximum value is $y = 2$ and the minimum value is $y = 0$. So, $A=\frac{2 - 0}{2}=1$.
Step3: Find the period $T$ and $B$
The period $T$ is the horizontal distance between two consecutive maxima or minima. Here, $T = 180^{\circ}=\pi$ (in radians). Since $T=\frac{2\pi}{B}$, and $T = \pi$, then $B = 2$.
Step4: Find the phase - shift $C$ and vertical shift $D$
The graph passes through the origin $(0,1)$. Substituting $x = 0$, $y = 1$, $A = 1$, and $B = 2$ into $y=A\sin(Bx - C)+D$, we get $1 = 1\times\sin(0 - C)+D$. The mid - line of the graph is $y = 1$, so $D = 1$. And since the graph starts at the mid - line value when $x = 0$, $C = 0$.
Answer:
$y=\sin(2x)+1$