how are the ranges of the functions the same? how are they different?
how are the ranges of the functions the same? how are they different?
Answer
Explanation:
Step1: Analyze first - graph range
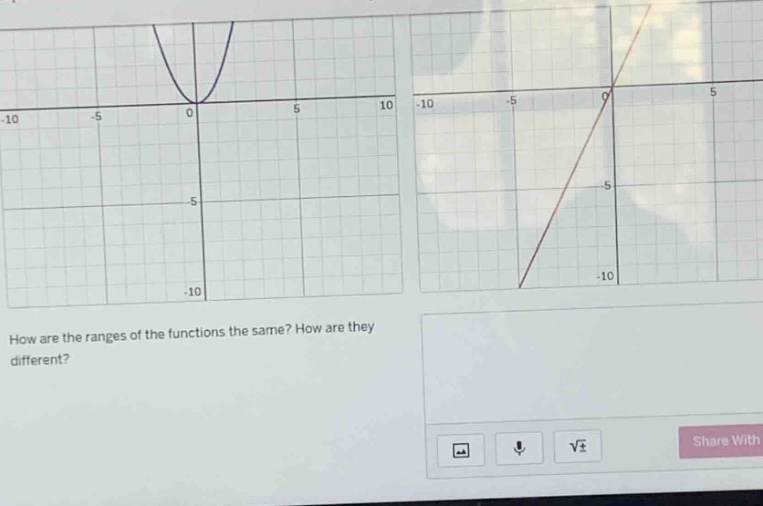
The first graph is a parabola opening upwards with vertex at the origin $(0,0)$. The range of a parabola $y = ax^{2}+bx + c$ (in this case $a>0$ and $b = c=0$) is $y\geq0$.
Step2: Analyze second - graph range
The second graph is a straight - line with a positive slope passing through the origin. The range of a non - vertical linear function $y=mx + b$ (here $m>0$ and $b = 0$) is all real numbers, $y\in(-\infty,\infty)$.
Step3: Compare ranges
Same: Both functions have non - negative values in their ranges since the parabola has $y\geq0$ and the line has non - negative $y$ values for $x\geq0$. Different: The range of the parabola is $y\geq0$, while the range of the line is all real numbers.
Answer:
Same: Both have non - negative values in their ranges. Different: The range of the parabola is $y\geq0$, and the range of the line is all real numbers.