record: 6 score: 6 the graph of the function f is shown below. at which of the following points is f(x)>0…
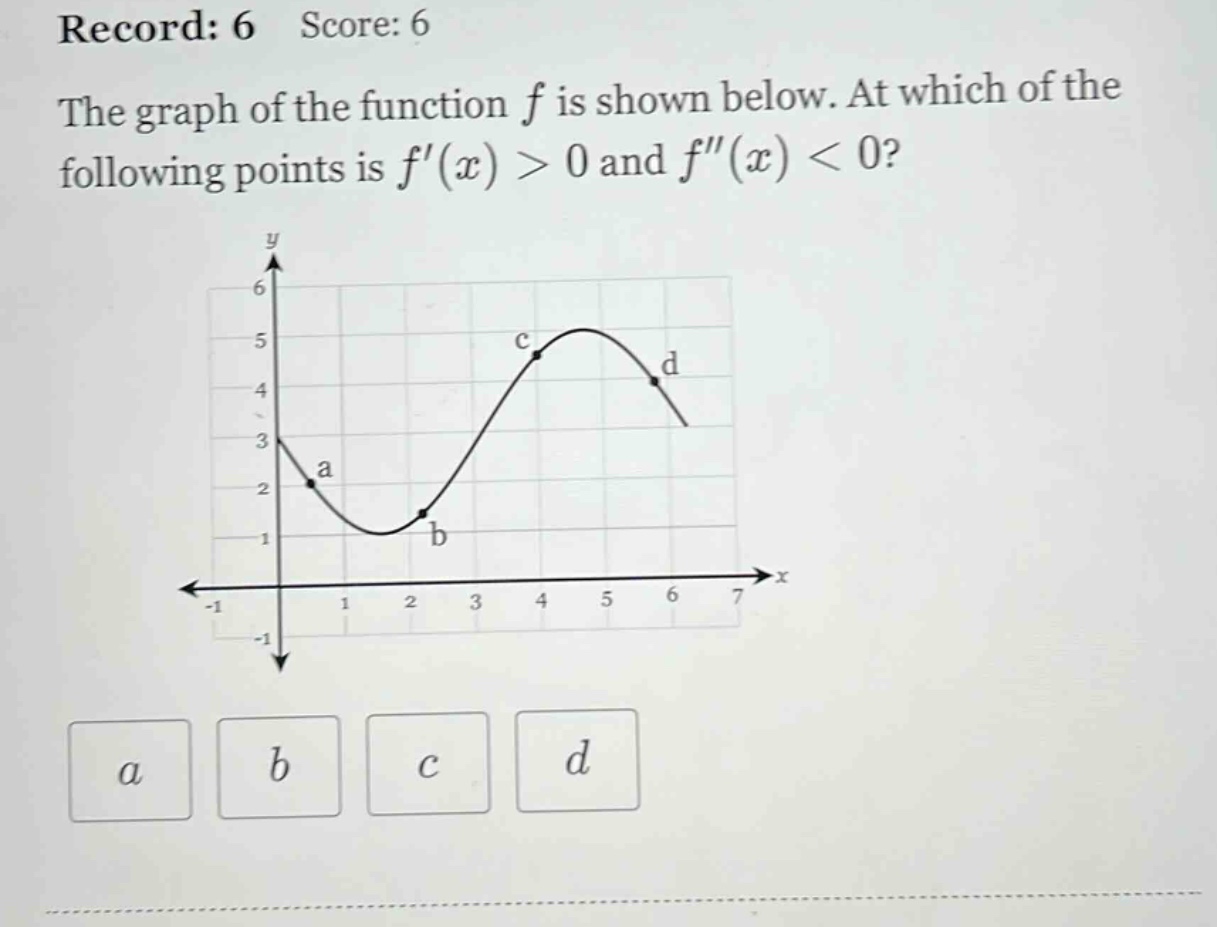
record: 6 score: 6 the graph of the function f is shown below. at which of the following points is f(x)>0 and f(x)<0? a b c d
Answer
Explanation:
Step1: Recall derivative - slope relationship
$f'(x)>0$ means the function is increasing. The function is increasing when the slope of the tangent - line to the curve is positive. Looking at the graph, the function is increasing at points $b$, $c$, and $d$ since the $y$ - values are getting larger as $x$ increases.
Step2: Recall second - derivative - concavity relationship
$f''(x)<0$ means the function is concave down. A function is concave down when the graph curves downward, and the tangent lines lie above the curve. The function is concave down at points $c$ and $d$ as the graph has a downward - curving shape.
Step3: Find the point that satisfies both conditions
The point that satisfies both $f'(x)>0$ and $f''(x)<0$ is point $d$.
Answer:
d