refer to the graph of f shown below. the solutions of the equation f(x) = 0 are the -intercepts of the graph…
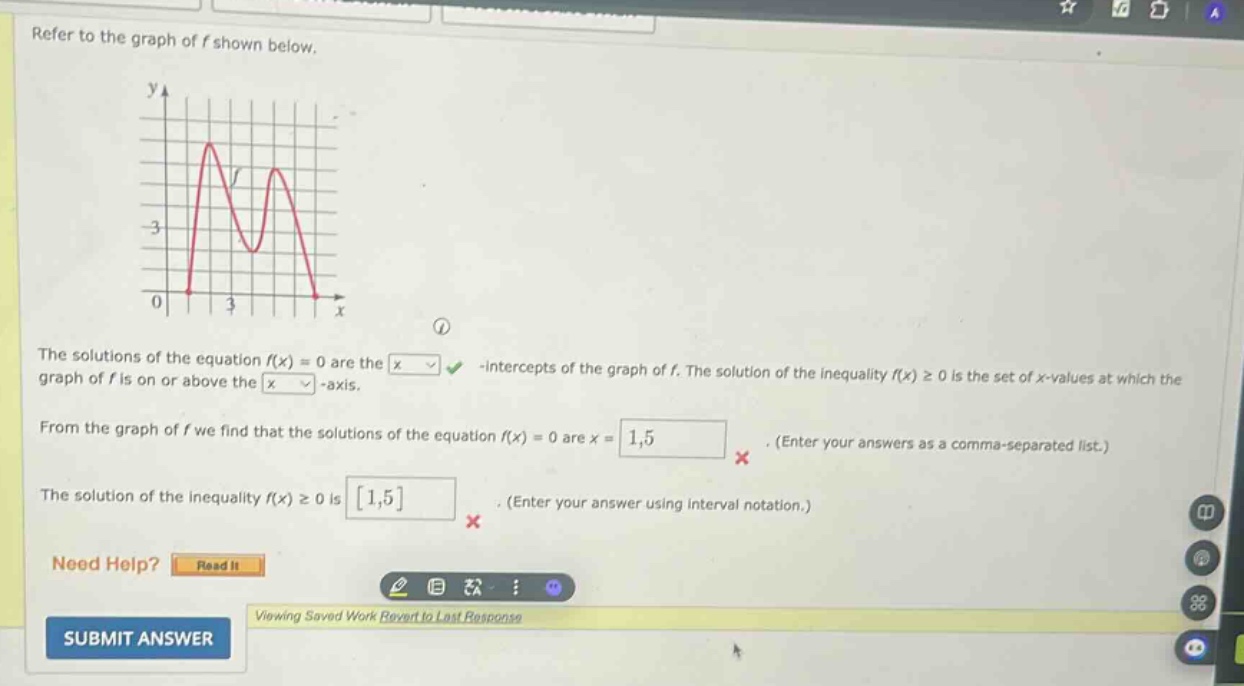
refer to the graph of f shown below. the solutions of the equation f(x) = 0 are the -intercepts of the graph of f. the solution of the inequality f(x) ≥ 0 is the set of x - values at which the graph of f is on or above the -axis. from the graph of f we find that the solutions of the equation f(x) = 0 are x = 1,5. (enter your answers as a comma - separated list.) the solution of the inequality f(x) ≥ 0 is 1,5. (enter your answer using interval notation.) need help? read it submit answer viewing saved work revert to last response
Answer
Explanation:
Step1: Identify x - intercepts
The x - intercepts of the graph of (y = f(x)) are the points where (f(x)=0). Looking at the graph, the curve crosses the x - axis at (x = 1) and (x = 5).
Step2: Find solution of inequality
The inequality (f(x)\geq0) is satisfied when the graph of (y = f(x)) is on or above the x - axis. From the graph, this occurs when (1\leq x\leq5). In interval notation, this is ([1,5]).
Answer:
The solutions of the equation (f(x) = 0) are (x = 1,5). The solution of the inequality (f(x)\geq0) is ([1,5])