the regions a, b, c, and d in the figure below are bounded by the graph of the function f and the x - axis…
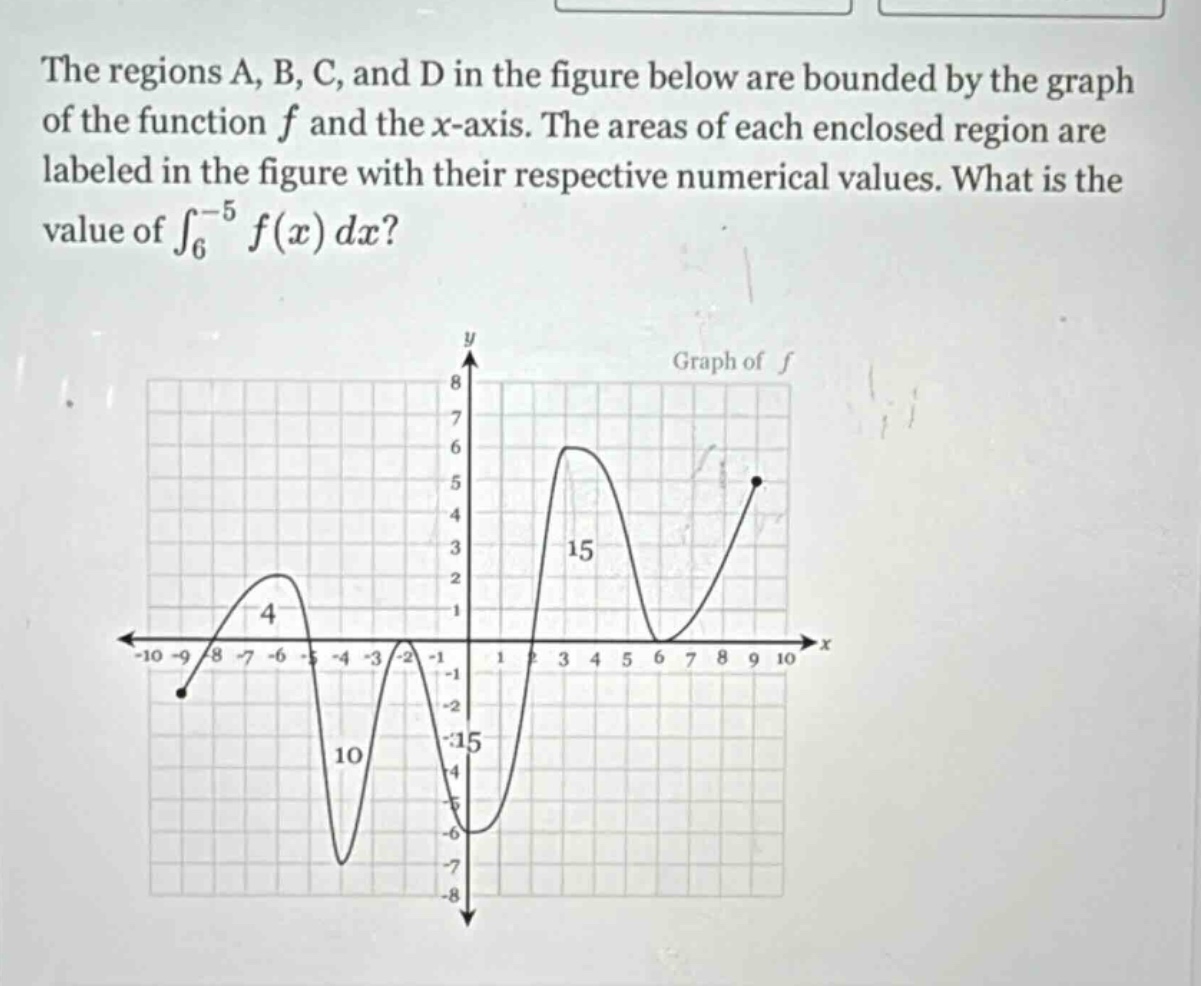
the regions a, b, c, and d in the figure below are bounded by the graph of the function f and the x - axis. the areas of each enclosed region are labeled in the figure with their respective numerical values. what is the value of ∫₆⁻⁵ f(x) dx? graph of f
Answer
Explanation:
Step1: Recall integral - area relationship
The definite integral $\int_{a}^{b}f(x)dx$ is the net - signed area between the curve $y = f(x)$ and the $x$ - axis from $x=a$ to $x = b$. Areas above the $x$ - axis are positive and areas below the $x$ - axis are negative.
Step2: Identify the regions for $\int_{6}^{-5}f(x)dx$
We want to find $\int_{6}^{-5}f(x)dx$. When we reverse the limits of integration, $\int_{6}^{-5}f(x)dx=-\int_{-5}^{6}f(x)dx$. The region from $x=-5$ to $x = 6$ consists of three sub - regions: a region of area $10$ below the $x$ - axis (negative), a region of area $15$ above the $x$ - axis (positive), and a region of area $15$ below the $x$ - axis (negative).
Step3: Calculate the value of $\int_{-5}^{6}f(x)dx$
$\int_{-5}^{6}f(x)dx=- 10 + 15-15=-10$.
Step4: Calculate the value of $\int_{6}^{-5}f(x)dx$
Since $\int_{6}^{-5}f(x)dx=-\int_{-5}^{6}f(x)dx$, then $\int_{6}^{-5}f(x)dx=-(-10) = 10$.
Answer:
$10$