review the graph of function g(x). who is correct? esai claims that limx→0g(x) is both -2 and -8 because the…
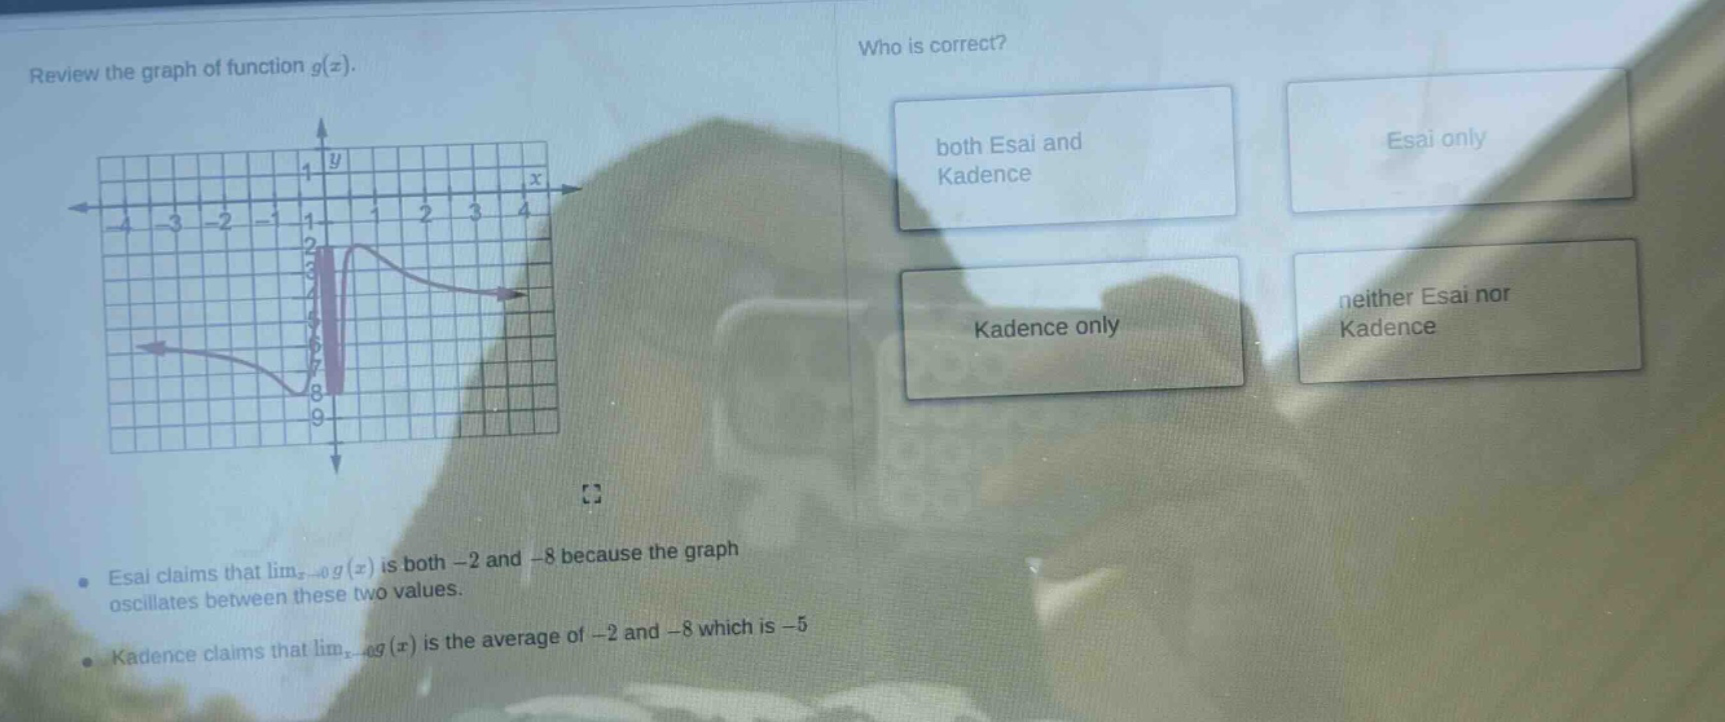
review the graph of function g(x). who is correct? esai claims that limx→0g(x) is both -2 and -8 because the graph oscillates between these two values. kadence claims that limx→0g(x) is the average of -2 and -8 which is -5 both esai and kadence esai only kadence only neither esai nor kadence
Answer
Explanation:
Step1: Recall limit - definition
The limit of a function as (x\to a) is a single value (L) if the function approaches (L) as (x) gets closer and closer to (a) from both sides. A function cannot have two distinct non - equal limits as (x\to a). Also, the limit is not the average of two values that the function oscillates between.
Step2: Analyze Esai's claim
Esai claims that (\lim_{x\to a}g(x)) is both (- 2) and (-8). By the definition of a limit, a function (y = g(x)) cannot have two different non - equal values as its limit as (x\to a). So Esai is incorrect.
Step3: Analyze Kadence's claim
Kadence claims that (\lim_{x\to a}g(x)) is the average of (-2) and (-8) (i.e., (-5)). The limit of a function is not calculated as an average of values that the function oscillates between. The limit is the value that the function approaches. So Kadence is incorrect.
Answer:
neither Esai nor Kadence