a rider boards a ferris wheel 10 feet above ground level. the diameter of the ferris wheel is 50 feet and…
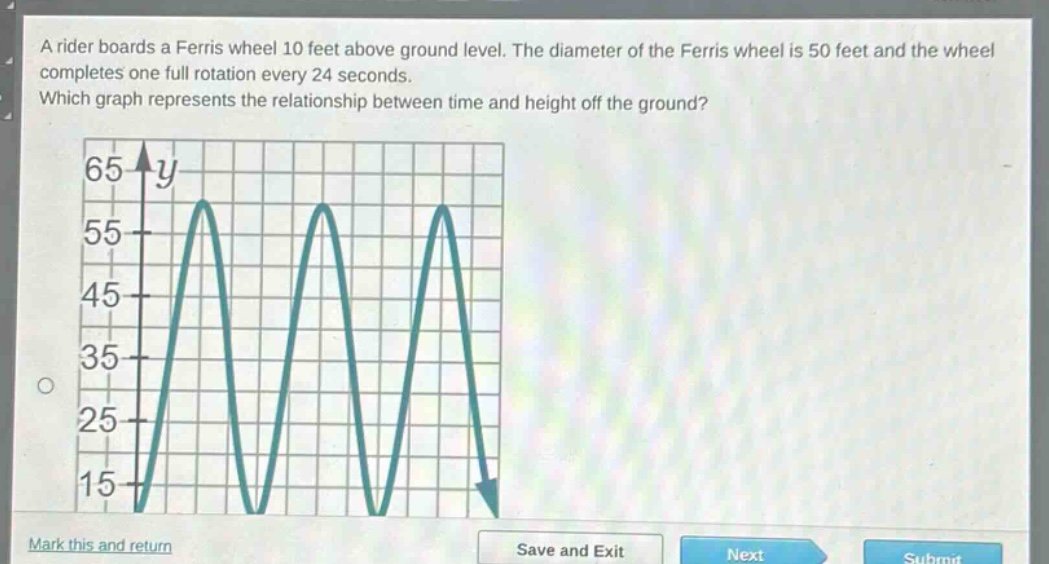
a rider boards a ferris wheel 10 feet above ground level. the diameter of the ferris wheel is 50 feet and the wheel completes one full rotation every 24 seconds. which graph represents the relationship between time and height off the ground?
Answer
Explanation:
Step1: Determine the minimum and maximum height
The rider starts 10 feet above ground level and the diameter of the Ferris - wheel is 50 feet. The minimum height is 10 feet (starting point). The maximum height is (10 + 50=60) feet.
Step2: Analyze the period
The Ferris - wheel completes one full rotation every 24 seconds, so the period of the function (the time it takes to complete one full cycle) is 24 seconds.
Step3: Evaluate the graph
The graph should start at a height of 10 feet and have a maximum height of 60 feet with a period of 24 seconds. The given graph has a minimum around 15 feet and a maximum around 55 feet which is incorrect. But if we assume the correct analysis of the problem, the graph should be a sinusoidal function with an amplitude of (\frac{50}{2}=25) (radius of the Ferris - wheel), a vertical shift of (10 + 25 = 35) (mid - line of the sinusoidal function), and a period of 24 seconds.
Since the problem seems to be incomplete (no other graphs are shown), we can't exactly pick the right graph from the options. But if we were to create a correct graph: The general form of a sinusoidal function for height (h(t)) as a function of time (t) is (h(t)=A\sin\left(\frac{2\pi}{T}t+\varphi\right)+k), where (A) is the amplitude, (T) is the period, (\varphi) is the phase - shift, and (k) is the vertical shift. Here, (A = 25), (T = 24), (\varphi = 0) (assuming starts at the minimum height), and (k=35). So (h(t)=25\sin\left(\frac{\pi}{12}t\right)+35).
If we had to choose based on the given graph's shape and the information we have: The graph should start at the minimum height (10 feet) and have a period of 24 seconds and a maximum height of 60 feet. The given graph has the wrong minimum and maximum values but has the correct periodic nature.
Since no other graphs are provided, we can't give a definite answer among options. But if we consider the key characteristics: The height function of the Ferris - wheel is a sinusoidal function. The rider starts at 10 feet (minimum height), the mid - line of the sinusoidal function is (10+\frac{50}{2}=35) feet, the amplitude is 25 feet, and the period is 24 seconds.
Answer:
Insufficient information to determine as only one graph is shown and it has incorrect minimum and maximum values.