select the graph of y = cot x.
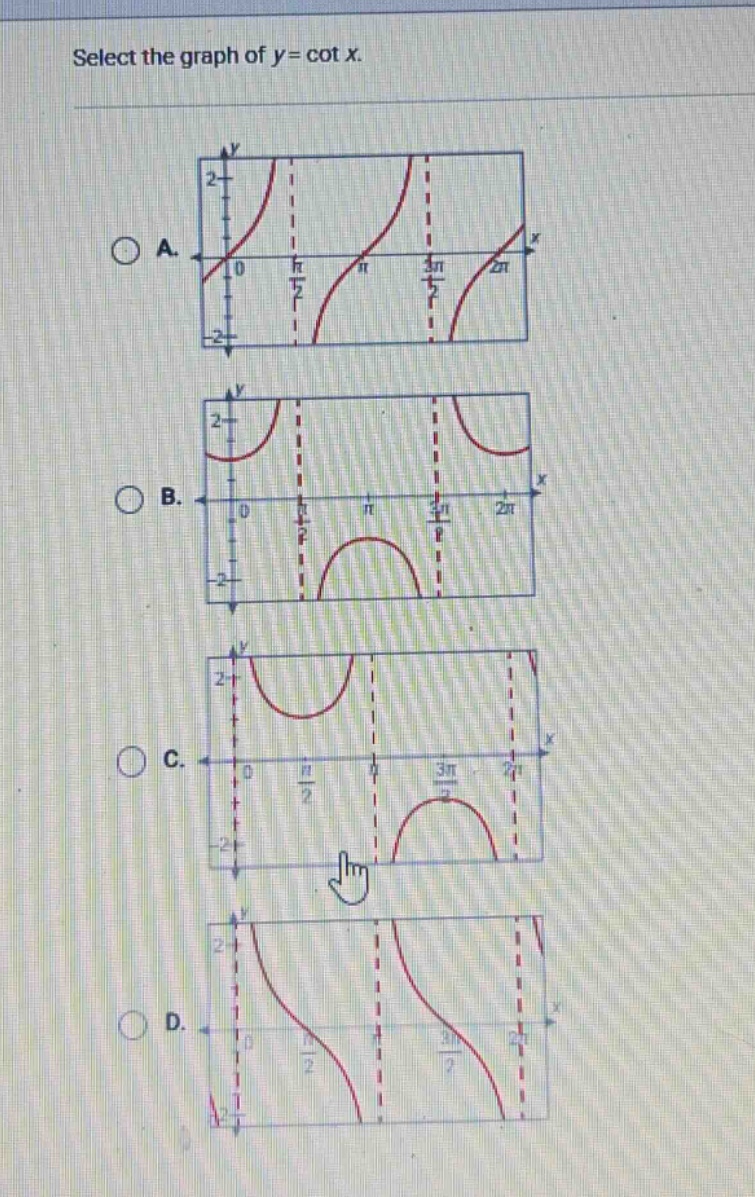
select the graph of y = cot x.
Answer
Explanation:
Step1: Recall cotangent function properties
The cotangent function $y = \cot x=\frac{\cos x}{\sin x}$. It has vertical - asymptotes at $x = n\pi$, where $n\in\mathbb{Z}$ (since $\sin x = 0$ at these points). Also, $\cot x = 0$ when $\cos x=0$, i.e., at $x=(2n + 1)\frac{\pi}{2},n\in\mathbb{Z}$. In the interval $(0,\pi)$, $\cot x$ is positive when $x\in(0,\frac{\pi}{2})$ and negative when $x\in(\frac{\pi}{2},\pi)$.
Step2: Analyze the graphs
- Option A: This graph has vertical asymptotes at $x = n\pi$ and crosses the $x$ - axis at $x=(2n + 1)\frac{\pi}{2}$. It is positive in $(0,\frac{\pi}{2})$ and negative in $(\frac{\pi}{2},\pi)$ which is consistent with the properties of $y = \cot x$.
- Option B: This graph has incorrect behavior near the vertical asymptotes and the sign - change is not as per the cotangent function.
- Option C: This graph has incorrect behavior near the vertical asymptotes and the shape is not that of a cotangent function.
- Option D: This graph has incorrect behavior near the vertical asymptotes and the sign - change is not as per the cotangent function.
Answer:
A.