this is similar to a problem in the textbook. year 1950 1960 1970 1980 1990 rate of change (million people…
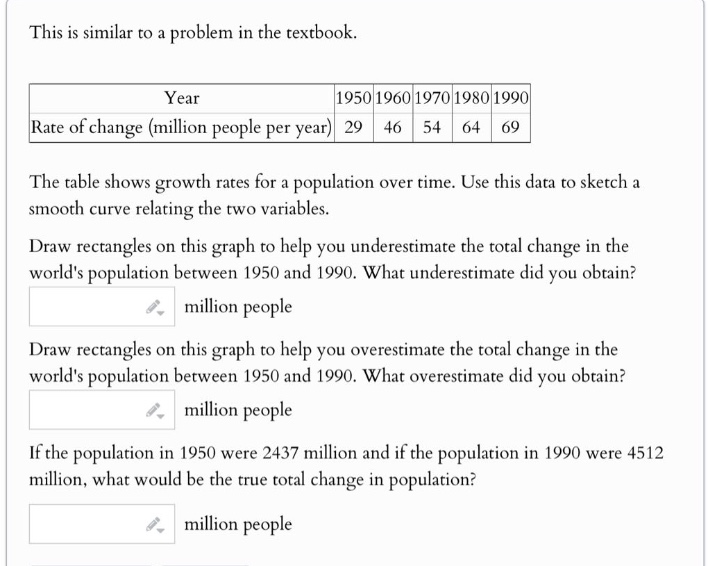
this is similar to a problem in the textbook. year 1950 1960 1970 1980 1990 rate of change (million people per year) 29 46 54 64 69 the table shows growth rates for a population over time. use this data to sketch a smooth curve relating the two variables. draw rectangles on this graph to help you underestimate the total change in the worlds population between 1950 and 1990. what underestimate did you obtain? million people draw rectangles on this graph to help you overestimate the total change in the worlds population between 1950 and 1990. what overestimate did you obtain? million people if the population in 1950 were 2437 million and if the population in 1990 were 4512 million, what would be the true total change in population? million people
Answer
Explanation:
Step1: Calculate underestimate
The underestimate is found by using the left - hand endpoints of the intervals. The intervals are of length 10 years. [ \begin{align*} \text{Underestimate}&=29\times10 + 46\times10+54\times10 + 64\times10\ &=(29 + 46+54 + 64)\times10\ &=(29+(46 + 54)+64)\times10\ &=(29 + 100+64)\times10\ &=193\times10\ &=1930 \end{align*} ]
Step2: Calculate overestimate
The overestimate is found by using the right - hand endpoints of the intervals. [ \begin{align*} \text{Overestimate}&=46\times10+54\times10 + 64\times10+69\times10\ &=(46 + 54+64 + 69)\times10\ &=(100+64 + 69)\times10\ &=(164+69)\times10\ &=233\times10\ &=2330 \end{align*} ]
Step3: Calculate true change
The true change in population is the population in 1990 minus the population in 1950. [4512−2437 = 2075]
Answer:
Underestimate: 1930 million people Overestimate: 2330 million people True change: 2075 million people