sketch a graph of the function f(x)=cos(x). -π/4 π/4 π/2 3π/4 π 5π/4 3π/2 7π/4 2π -1 -2 clear all draw…
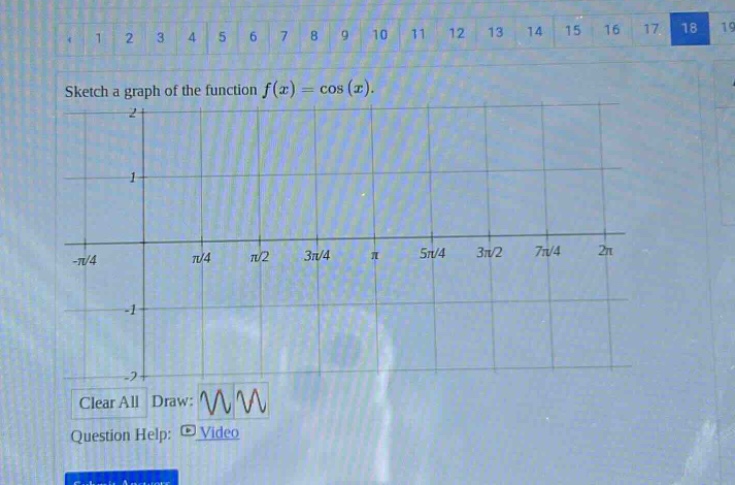
sketch a graph of the function f(x)=cos(x). -π/4 π/4 π/2 3π/4 π 5π/4 3π/2 7π/4 2π -1 -2 clear all draw: question help: video
Answer
Explanation:
Step1: Recall key - points of cosine function
The cosine function $y = \cos(x)$ has a period of $2\pi$. Its range is $[- 1,1]$. At $x = 0$, $\cos(0)=1$; at $x=\frac{\pi}{2}$, $\cos(\frac{\pi}{2}) = 0$; at $x=\pi$, $\cos(\pi)=-1$; at $x=\frac{3\pi}{2}$, $\cos(\frac{3\pi}{2}) = 0$; at $x = 2\pi$, $\cos(2\pi)=1$.
Step2: Plot key - points
Plot the points $(0,1),(\frac{\pi}{4},\frac{\sqrt{2}}{2}),(\frac{\pi}{2},0),(\frac{3\pi}{4},-\frac{\sqrt{2}}{2}),(\pi,-1),(\frac{5\pi}{4},-\frac{\sqrt{2}}{2}),(\frac{3\pi}{2},0),(\frac{7\pi}{4},\frac{\sqrt{2}}{2}),(2\pi,1)$ on the given grid.
Step3: Draw the curve
Connect the plotted points with a smooth curve. The curve should repeat every $2\pi$ units.
Answer:
Sketch the curve by following the above - mentioned steps on the given grid.