sketch the graph of a function f that is defined on ℝ and continuous except for the stated discontinuities…
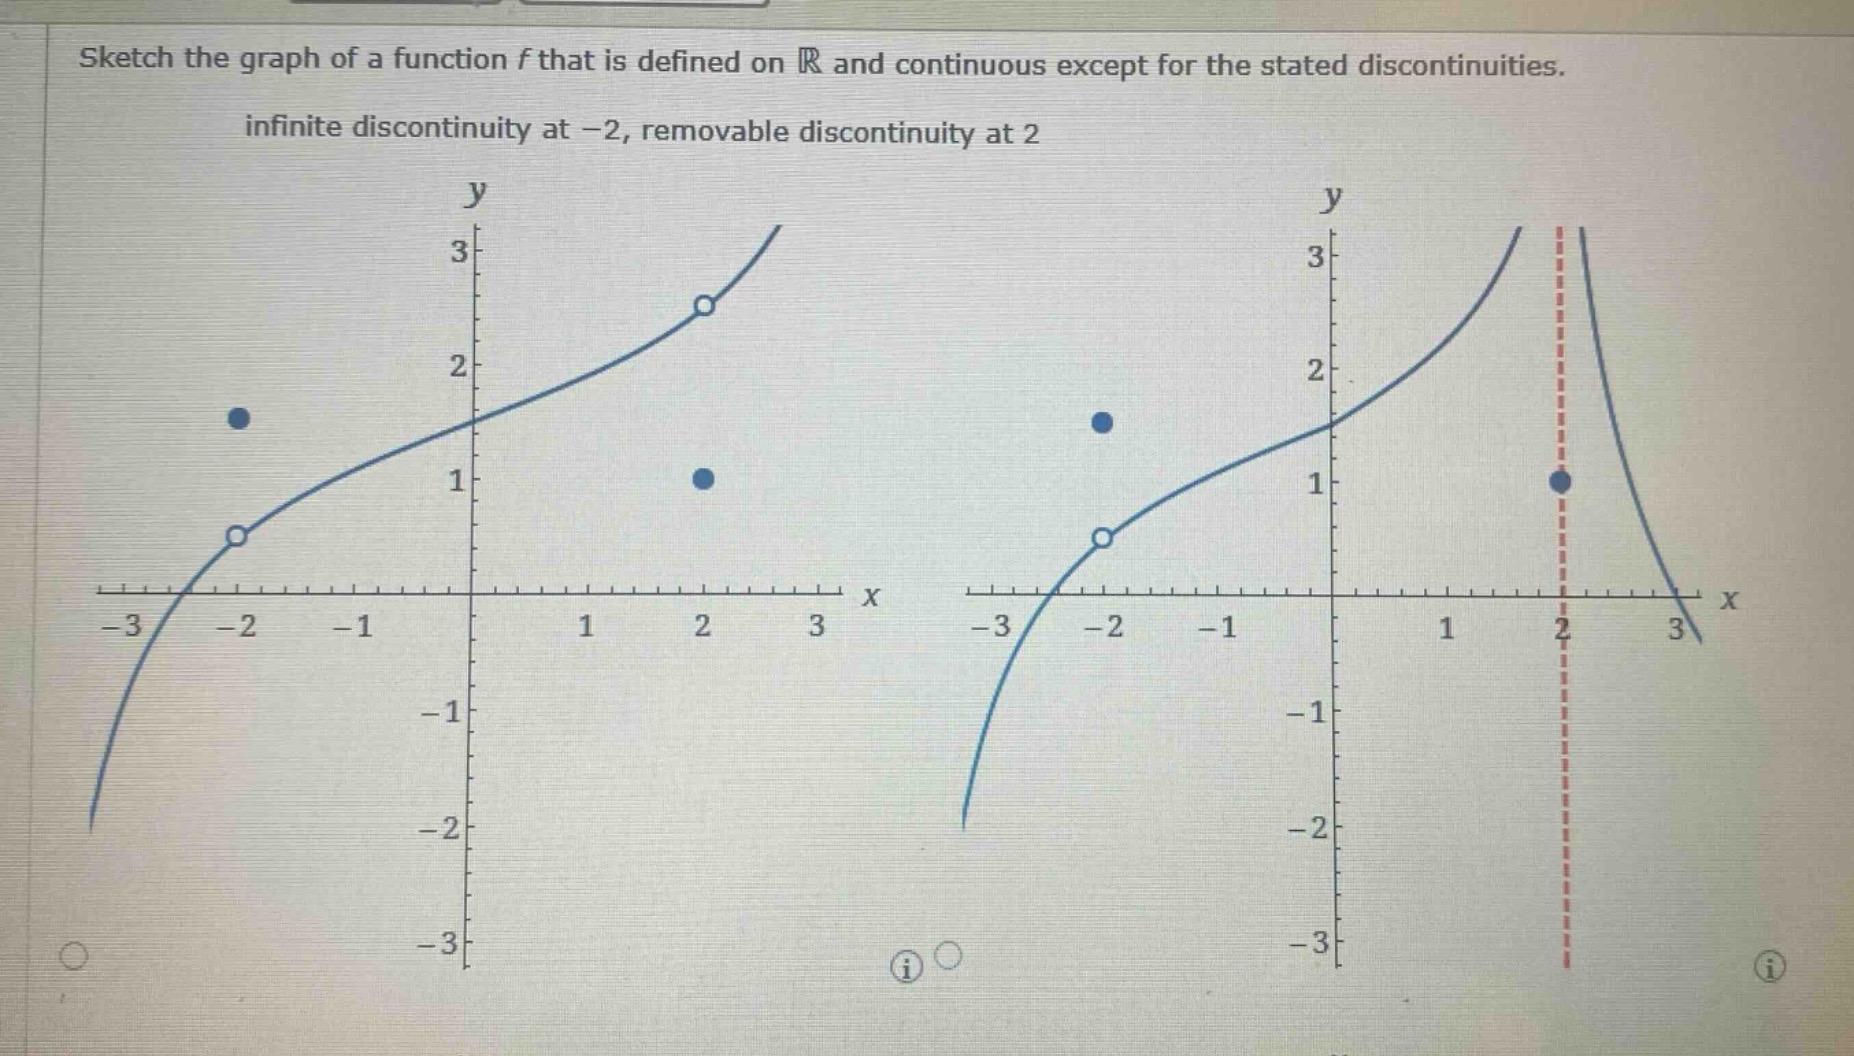
sketch the graph of a function f that is defined on ℝ and continuous except for the stated discontinuities. infinite discontinuity at -2, removable discontinuity at 2
Answer
Explanation:
Step1: Understand infinite discontinuity
At $x = - 2$, for an infinite discontinuity, the function values approach $\pm\infty$. We can draw the graph such that as $x$ approaches $-2$ from the left and right, the function shoots up or down to infinity. For example, we can have the function go to positive infinity as $x\to - 2^{+}$ and negative infinity as $x\to - 2^{-}$.
Step2: Understand removable discontinuity
At $x = 2$, for a removable discontinuity, the limit of the function as $x$ approaches $2$ exists, but the function is not defined or has a different value at $x = 2$. We can draw a smooth curve that approaches a particular $y -$ value as $x$ approaches $2$, but put an open - circle at the point on the curve corresponding to $x = 2$ and then put a dot at a different $y -$ value for $x = 2$.
Answer:
A graph with a vertical asymptote at $x=-2$ (infinite discontinuity) and a hole (open - circle) at a point on the curve for $x = 2$ and a separate point (filled - circle) at a different $y -$ value for $x = 2$ (removable discontinuity) is a correct sketch. The exact shape of the smooth parts of the curve between and outside of these points can vary as long as the function is continuous everywhere else on $\mathbb{R}$.