6. sketch a graph of a function satisfying the following conditions. label extrema or inflection points…
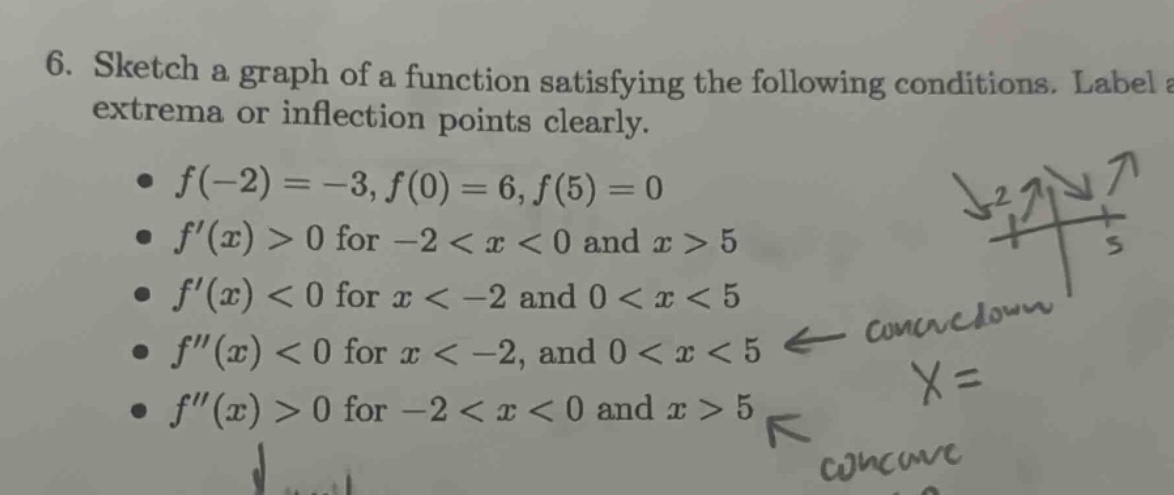
6. sketch a graph of a function satisfying the following conditions. label extrema or inflection points clearly.\n• f(-2)=-3,f(0)=6,f(5)=0\n• f(x)>0 for -2<x<0 and x>5\n• f(x)<0 for x<-2 and 0<x<5\n• f(x)<0 for x<-2, and 0<x<5\n• f(x)>0 for -2<x<0 and x>5
Answer
Explanation:
Step1: Analyze critical - points
The critical points occur where (f^{\prime}(x)=0) or is undefined. Since (f^{\prime}(x)) changes sign at (x = - 2), (x=0) and (x = 5), these are critical points. (f(-2)=-3), (f(0)=6) and (f(5)=0).
Step2: Determine extrema
Since (f^{\prime}(x)) changes from negative to positive at (x=-2), (f(-2)=-3) is a local minimum. Since (f^{\prime}(x)) changes from positive to negative at (x = 0), (f(0)=6) is a local maximum. Since (f^{\prime}(x)) changes from negative to positive at (x = 5), (f(5)=0) is a local minimum.
Step3: Analyze concavity
The function is concave - down when (f^{\prime\prime}(x)<0) (for (x < - 2) and (0<x<5)) and concave - up when (f^{\prime\prime}(x)>0) (for (-2 < x<0) and (x>5)). Inflection points occur where (f^{\prime\prime}(x)) changes sign, which are at (x=-2), (x = 0) and (x = 5).
Step4: Sketch the graph
Start by plotting the points ((-2,-3)), ((0,6)) and ((5,0)). For (x<-2), the function is decreasing and concave - down. Between (-2) and (0), the function is increasing and concave - up. Between (0) and (5), the function is decreasing and concave - down. For (x>5), the function is increasing and concave - up.
Answer:
A graph with local minimum at ((-2,-3)) and ((5,0)), local maximum at ((0,6)), inflection points at (x=-2), (x = 0) and (x = 5), decreasing on ((-\infty,-2)\cup(0,5)), increasing on ((-2,0)\cup(5,\infty)), concave - down on ((-\infty,-2)\cup(0,5)) and concave - up on ((-2,0)\cup(5,\infty)) should be sketched.