sketch a graph of the function f(x)=-3 sin(1/4 x) clear all draw: question help: video
sketch a graph of the function f(x)=-3 sin(1/4 x) clear all draw: question help: video
Answer
Explanation:
Step1: Identify the amplitude
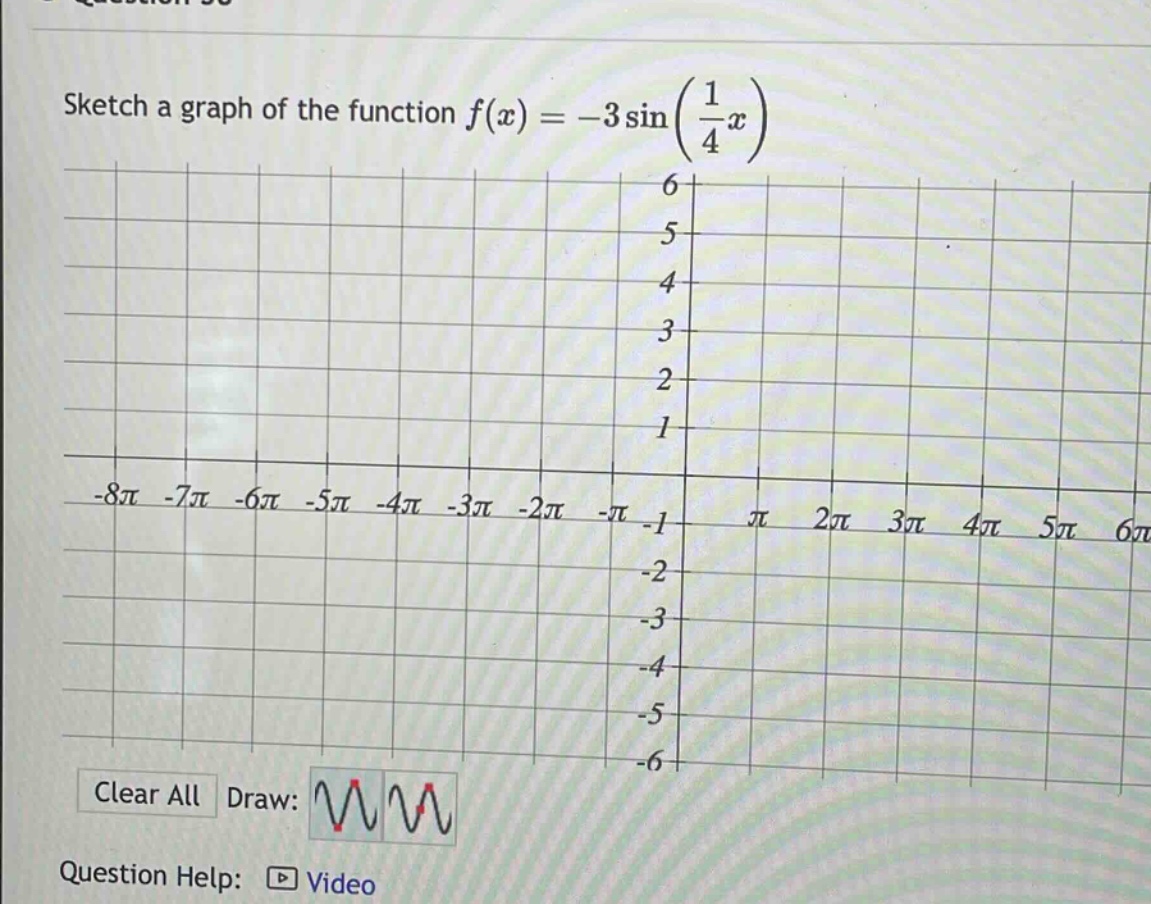
The general form of a sine - function is $y = A\sin(Bx - C)+D$. For the function $f(x)=- 3\sin(\frac{1}{4}x)$, the amplitude $|A|$. Here $A=-3$, so the amplitude is $| - 3| = 3$. This means the graph oscillates between $y = 3$ and $y=-3$.
Step2: Identify the period
The period of a sine - function $y = \sin(Bx)$ is given by $T=\frac{2\pi}{|B|}$. For the function $f(x)=-3\sin(\frac{1}{4}x)$, $B = \frac{1}{4}$. So the period $T=\frac{2\pi}{\frac{1}{4}}=8\pi$.
Step3: Find key - points
We know that for the sine function $y = \sin(x)$, the key - points in one period are $(0,0),(\frac{\pi}{2},1),(\pi,0),(\frac{3\pi}{2}, - 1),(2\pi,0)$. For the function $y=-3\sin(\frac{1}{4}x)$, when $x = 0$, $y=-3\sin(0)=0$; when $x = 2\pi$, $y=-3\sin(\frac{2\pi}{4})=-3$; when $x = 4\pi$, $y=-3\sin(\pi)=0$; when $x = 6\pi$, $y=-3\sin(\frac{6\pi}{4}) = 3$; when $x = 8\pi$, $y=-3\sin(2\pi)=0$.
Step4: Sketch the graph
Plot the key - points $(0,0),(2\pi,-3),(4\pi,0),(6\pi,3),(8\pi,0)$ and then connect them with a smooth curve. The graph is a sine - wave that oscillates between $y = 3$ and $y=-3$ with a period of $8\pi$ and is reflected about the $x$ - axis due to the negative sign in front of the 3.
Answer:
Sketch a sine - wave with amplitude 3, period $8\pi$, passing through the points $(0,0),(2\pi,-3),(4\pi,0),(6\pi,3),(8\pi,0)$ and connecting them with a smooth curve.