sketch a graph of y = sin t for - 2π≤t≤2π. choose the correct graph below.
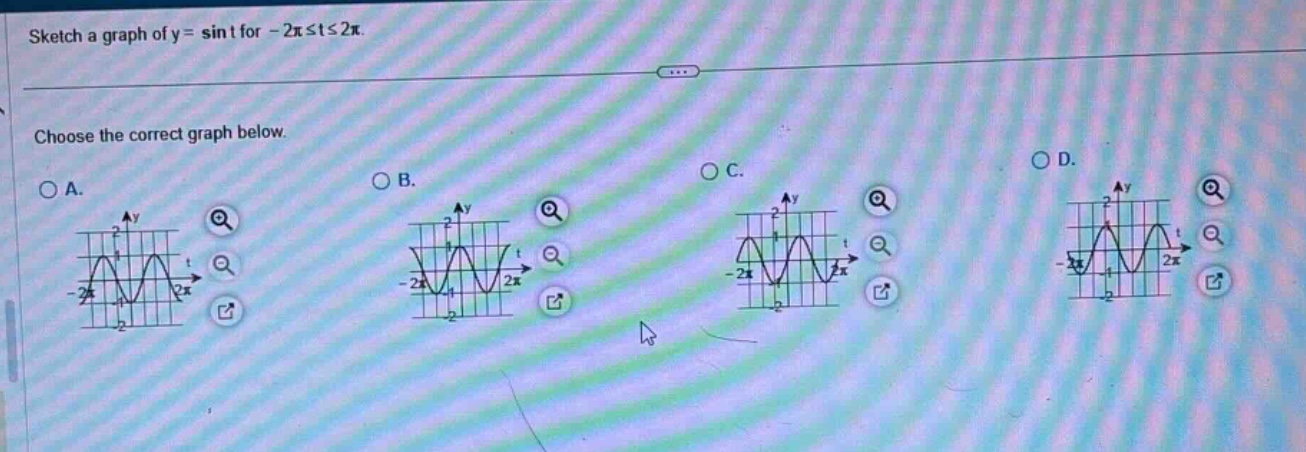
sketch a graph of y = sin t for - 2π≤t≤2π. choose the correct graph below.
Answer
Explanation:
Step1: Recall properties of sine - function
The function (y = \sin t) has an amplitude of (A = 1), a period of (T=2\pi), and it passes through the origin ((0,0)). It has a maximum value of (y = 1) at (t=\frac{\pi}{2}+ 2k\pi,k\in\mathbb{Z}) and a minimum value of (y=-1) at (t = \frac{3\pi}{2}+2k\pi,k\in\mathbb{Z}) in the domain (-2\pi\leq t\leq2\pi), when (k = 0), the maximum is at (t=\frac{\pi}{2}) and the minimum is at (t=\frac{3\pi}{2}), when (k=- 1), the maximum is at (t =-\frac{3\pi}{2}) and the minimum is at (t=-\frac{\pi}{2}).
Step2: Analyze the graphs
We know that (\sin(0)=0), (\sin(\frac{\pi}{2}) = 1), (\sin(\pi)=0), (\sin(\frac{3\pi}{2})=-1), (\sin(2\pi)=0). The graph of (y = \sin t) starts at the origin ((0,0)), goes up to (y = 1) at (t=\frac{\pi}{2}), comes back down to (y = 0) at (t=\pi), goes down to (y=-1) at (t=\frac{3\pi}{2}) and back up to (y = 0) at (t = 2\pi), and has a similar pattern in the negative - (t) values.
Answer:
The correct graph is the one that has an amplitude of 1, a period of (2\pi), passes through the origin ((0,0)), has maximum values of 1 and minimum values of - 1. Without seeing the exact details of each option, but based on the general shape of the sine - function, the standard sine - wave graph with the given domain (-2\pi\leq t\leq2\pi) is the correct choice. If we assume a standard - looking sine - wave graph among the options, it should be the one that starts at ((0,0)), oscillates between (y=-1) and (y = 1) with a period of (2\pi).