solve the following questions - for the graphs below, determine the amplitude, mid - line, maximum, minimum…
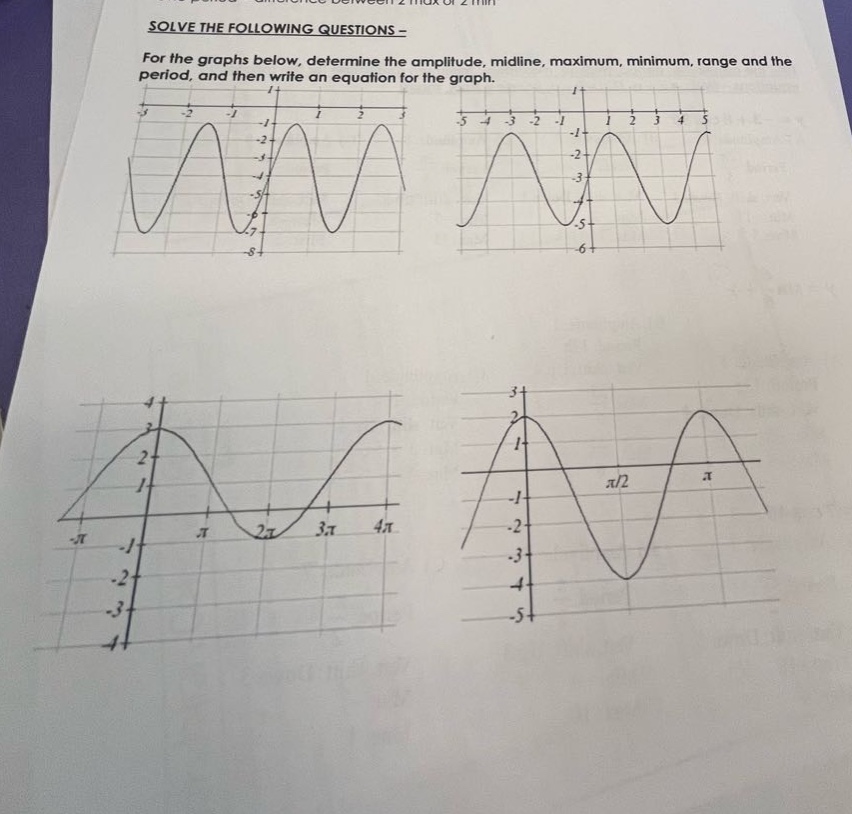
solve the following questions - for the graphs below, determine the amplitude, mid - line, maximum, minimum, range and the period, and then write an equation for the graph.
Answer
Explanation:
Step1: Define amplitude
Amplitude is half the vertical distance between maximum and minimum.
Step2: Find mid - line
Mid - line is the horizontal line halfway between maximum and minimum.
Step3: Determine maximum and minimum
Read from the graph.
Step4: Calculate range
Range is the set of all possible y - values, from minimum to maximum.
Step5: Find period
Period is the horizontal distance between two consecutive maximums or minimums.
Step6: Write the equation
For a sine or cosine function of the form $y = A\sin(B(x - C))+D$ or $y = A\cos(B(x - C))+D$, $A$ is amplitude, $B$ helps find period ($T=\frac{2\pi}{|B|}$), $C$ is phase - shift and $D$ is mid - line.
Let's take the first graph as an example:
- Amplitude ($A$): The maximum value is $y = 1$ and the minimum value is $y=-7$. The amplitude $A=\frac{1 - (-7)}{2}=\frac{8}{2} = 4$.
- Mid - line ($D$): $D=\frac{1+( - 7)}{2}=\frac{-6}{2}=-3$.
- Maximum: $y = 1$.
- Minimum: $y=-7$.
- Range: $[-7,1]$.
- Period: The distance between two consecutive maximums (e.g., from $x=-1$ to $x = 1$) is $T = 2$. Since $T=\frac{2\pi}{|B|}$ and $T = 2$, then $B=\pi$. Assuming no phase - shift ($C = 0$), the equation of the sine function is $y=4\sin(\pi x)-3$.
For the second graph:
- Amplitude ($A$): The maximum value is $y = 1$ and the minimum value is $y=-5$. The amplitude $A=\frac{1-(-5)}{2}=\frac{6}{2}=3$.
- Mid - line ($D$): $D=\frac{1+( - 5)}{2}=\frac{-4}{2}=-2$.
- Maximum: $y = 1$.
- Minimum: $y=-5$.
- Range: $[-5,1]$.
- Period: The distance between two consecutive maximums (e.g., from $x=-1$ to $x = 1$) is $T = 2$. Since $T=\frac{2\pi}{|B|}$ and $T = 2$, then $B=\pi$. Assuming no phase - shift ($C = 0$), the equation of the sine function is $y = 3\sin(\pi x)-2$.
For the third graph:
- Amplitude ($A$): The maximum value is $y = 3$ and the minimum value is $y=-1$. The amplitude $A=\frac{3-(-1)}{2}=\frac{4}{2}=2$.
- Mid - line ($D$): $D=\frac{3+( - 1)}{2}=1$.
- Maximum: $y = 3$.
- Minimum: $y=-1$.
- Range: $[-1,3]$.
- Period: The distance between two consecutive maximums (e.g., from $x = 0$ to $x = 2\pi$) is $T = 2\pi$. Since $T=\frac{2\pi}{|B|}$ and $T = 2\pi$, then $B = 1$. Assuming no phase - shift ($C = 0$), the equation of the cosine function is $y=2\cos(x)+1$.
For the fourth graph:
- Amplitude ($A$): The maximum value is $y = 2$ and the minimum value is $y=-4$. The amplitude $A=\frac{2-(-4)}{2}=\frac{6}{2}=3$.
- Mid - line ($D$): $D=\frac{2+( - 4)}{2}=-1$.
- Maximum: $y = 2$.
- Minimum: $y=-4$.
- Range: $[-4,2]$.
- Period: The distance between two consecutive maximums (e.g., from $x = 0$ to $x=\pi$) is $T=\pi$. Since $T=\frac{2\pi}{|B|}$ and $T=\pi$, then $B = 2$. Assuming no phase - shift ($C = 0$), the equation of the cosine function is $y=3\cos(2x)-1$.
Answer:
For the first graph: Amplitude = 4, Mid - line: $y=-3$, Maximum: $y = 1$, Minimum: $y=-7$, Range: $[-7,1]$, Period: 2, Equation: $y = 4\sin(\pi x)-3$. For the second graph: Amplitude = 3, Mid - line: $y=-2$, Maximum: $y = 1$, Minimum: $y=-5$, Range: $[-5,1]$, Period: 2, Equation: $y = 3\sin(\pi x)-2$. For the third graph: Amplitude = 2, Mid - line: $y = 1$, Maximum: $y = 3$, Minimum: $y=-1$, Range: $[-1,3]$, Period: $2\pi$, Equation: $y=2\cos(x)+1$. For the fourth graph: Amplitude = 3, Mid - line: $y=-1$, Maximum: $y = 2$, Minimum: $y=-4$, Range: $[-4,2]$, Period: $\pi$, Equation: $y=3\cos(2x)-1$.