which statement best describes the function represented by the graph? the function is increasing on the…
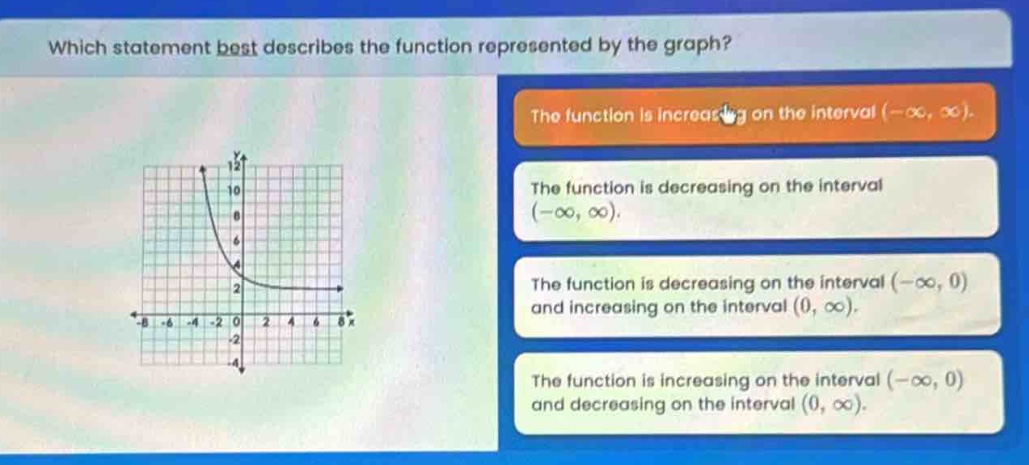
which statement best describes the function represented by the graph? the function is increasing on the interval (-∞, ∞). the function is decreasing on the interval (-∞, ∞). the function is decreasing on the interval (-∞, 0) and increasing on the interval (0, ∞). the function is increasing on the interval (-∞, 0) and decreasing on the interval (0, ∞).
Answer
Answer:
The function is decreasing on the interval $(-\infty,\infty)$.
Explanation:
Step1: Observe the graph trend
As $x$ - values increase from $-\infty$ to $\infty$, the $y$ - values of the function are getting smaller. So the function is decreasing over the entire real - number line $(-\infty,\infty)$.