suppose that the function h is defined, for all real numbers, as follows.\n\n$$ h ( x ) = left{…
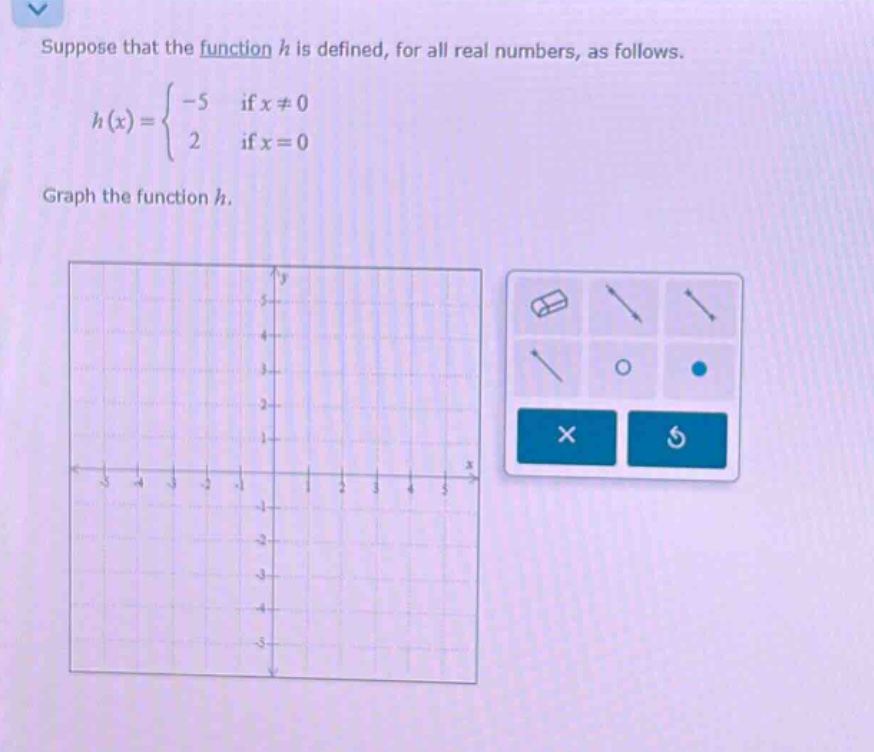
suppose that the function h is defined, for all real numbers, as follows.\n\n$$ h ( x ) = left{ \begin{array} { l l } { - 5 } & { \text { if } x \neq 0 } \\ { 2 } & { \text { if } x = 0 } end{array} \right. $$\n\ngraph the function h.
Answer
Explanation:
Step1: Analyze the function for (x\neq0)
For (x\neq0), (h(x)= - 5). This is a horizontal line (y = - 5) with a hole at (x = 0) (since the function is not defined as (-5) when (x = 0)).
Step2: Analyze the function for (x = 0)
When (x=0), (h(x)=2). So we plot the point ((0,2)) as a solid dot.
To graph:
- Use the "line" tool (the straight - line icons) to draw the horizontal line (y=-5) across the entire (x) - axis except at (x = 0). At (x = 0) on the line (y=-5), use the "open - circle" tool (the (○) icon) to indicate the hole.
- Use the "solid - dot" tool (the (●) icon) to plot the point ((0,2)).
Answer:
Follow the steps above using the provided graphing tools (line for (y = - 5) with a hole at (x = 0) and a solid dot at ((0,2))) to graph the function (h(x)).