which table describes the behavior of the graph of f(x)=2x^3 - 26x - 24?\ninterval\trelation of graph to x…
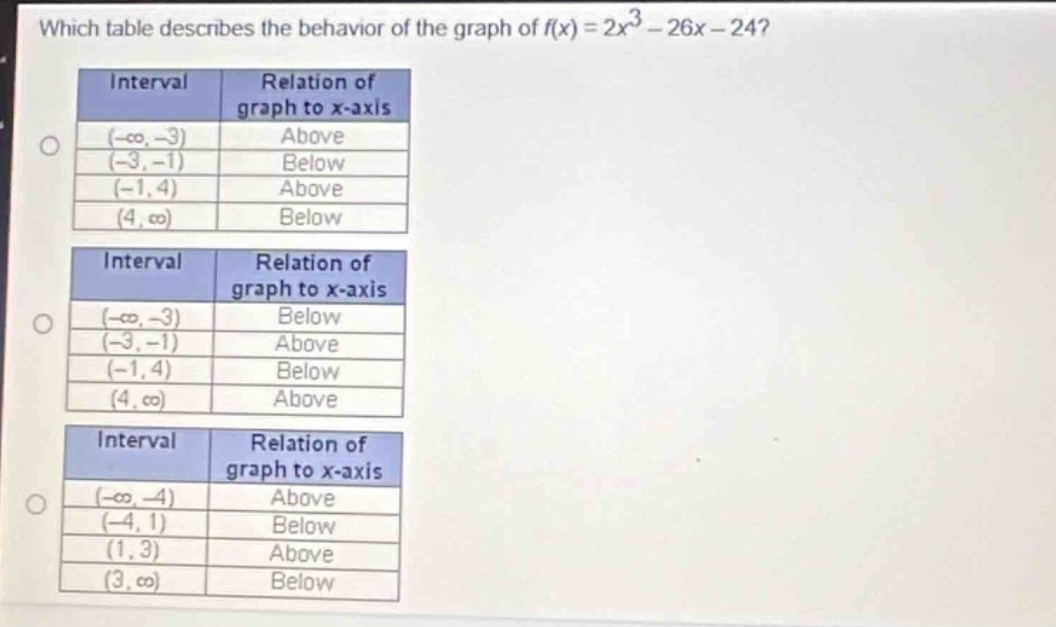
which table describes the behavior of the graph of f(x)=2x^3 - 26x - 24?\ninterval\trelation of graph to x - axis\n(-∞, - 3)\tabove\n(-3, - 1)\tbelow\n(-1, 4)\tabove\n(4, ∞)\tbelow\n\ninterval\trelation of graph to x - axis\n(-∞, - 3)\tbelow\n(-3, - 1)\tabove\n(-1, 4)\tbelow\n(4, ∞)\tabove\n\ninterval\trelation of graph to x - axis\n(-∞, - 4)\tabove\n(-4, 1)\tbelow\n(1, 3)\tabove\n(3, ∞)\tbelow
Answer
Explanation:
Step1: Find the roots of the function
Set $f(x)=2x^{3}-26x - 24 = 0$. First, factor out a 2: $2(x^{3}-13x - 12)=0$, so $x^{3}-13x - 12 = 0$. By trial - and - error, we find that $x=-1$ is a root. Then we perform polynomial long - division: $(x^{3}-13x - 12)\div(x + 1)=x^{2}-x - 12$. Factoring $x^{2}-x - 12=(x + 3)(x - 4)$. So the roots of $f(x)$ are $x=-3,x=-1,x = 4$.
Step2: Test intervals
Choose test points in the intervals $(-\infty,-3),(-3,-1),(-1,4),(4,\infty)$. For the interval $(-\infty,-3)$, let $x=-4$. Then $f(-4)=2(-4)^{3}-26(-4)-24=2(-64)+104 - 24=-128 + 104-24=-48<0$, so the graph is below the $x$ - axis. For the interval $(-3,-1)$, let $x=-2$. Then $f(-2)=2(-2)^{3}-26(-2)-24=2(-8)+52 - 24=-16 + 52-24 = 12>0$, so the graph is above the $x$ - axis. For the interval $(-1,4)$, let $x = 0$. Then $f(0)=2(0)^{3}-26(0)-24=-24<0$, so the graph is below the $x$ - axis. For the interval $(4,\infty)$, let $x = 5$. Then $f(5)=2(5)^{3}-26(5)-24=2(125)-130 - 24=250-130 - 24 = 96>0$, so the graph is above the $x$ - axis.
Answer:
The table with the intervals $(-\infty,-3)$ (Below), $(-3,-1)$ (Above), $(-1,4)$ (Below), $(4,\infty)$ (Above) describes the behavior of the graph.